Figure 2.

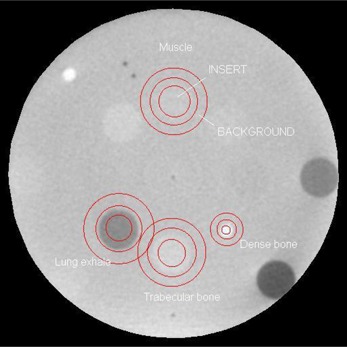
Regions of interest contoured on phantom image used for contrast‐to‐noise ratio calculation: the circular signal and the ring‐shaped background are centered in each insert of different electron density.

Regions of interest contoured on phantom image used for contrast‐to‐noise ratio calculation: the circular signal and the ring‐shaped background are centered in each insert of different electron density.