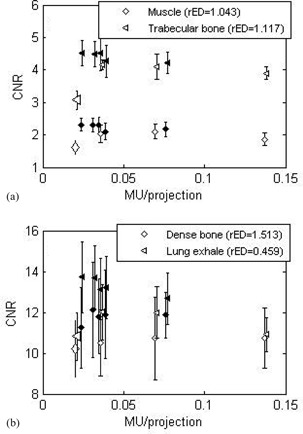
Figure 5.

Contrast‐to‐noise ratio as a function of the MU/projection, for the full arc (empty symbols) and the short arc (solid symbols) for: (a) low‐contrast inserts and (b) high‐contrast inserts, measured on the CIRS phantom. The low MU protocol is displayed as the large open symbols. Error bars correspond to one standard deviation of the measurements taken over six consecutive slices.
