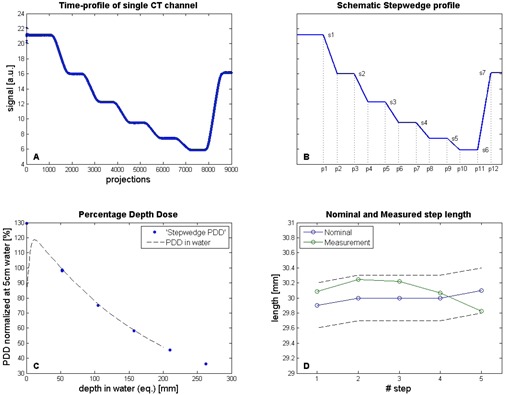
Figure 3.

Analyses of the time profile of one MVCT detector channel during the step‐wedge QA procedure: (A) MVCT detector signal course over time for one CT channel, corrected for output (monitor chamber) given in arbitrary units (a.u.); (B) schematic profile fitted to the MVCT signal time course (panel A); (C) percentage depth dose (PDD) derived from the six fitted step‐wedge profile levels, normalized to the dose value at 5 cm water depth; (D) measured length of the five separate steps (green symbols) derived from the fitted step‐wedge profile compared with the nominal step length (blue symbols) within a range of (dotted lines). Measured points are connected with solid lines to enhance visibility.
