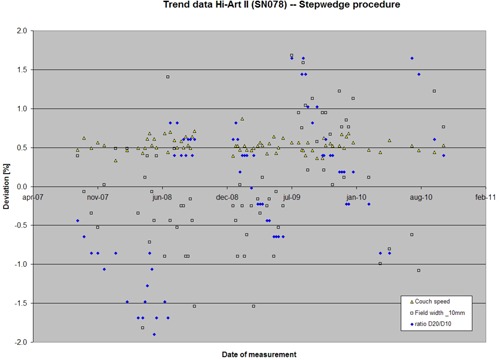
Figure 8.

Machine behavior over a three‐year period. Behavior is measured with the step‐wedge procedure. Shown are variations in couch speed (nominal 1 mm/sec), field width (nominal 10 mm at iso), and ratio D20/D10. Deviations are presented in percentages, relative to a reference value. The jumps in D20/D10 ratio correspond to subsequent target changes.
