Figure 3.

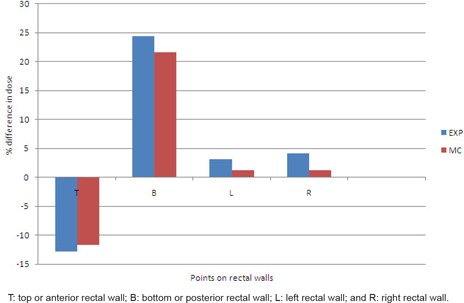
Bar chart of percentage difference in dose at rectal walls determined considering medium‐filled rectum and air‐filled rectum.

Bar chart of percentage difference in dose at rectal walls determined considering medium‐filled rectum and air‐filled rectum.