Figure 3.

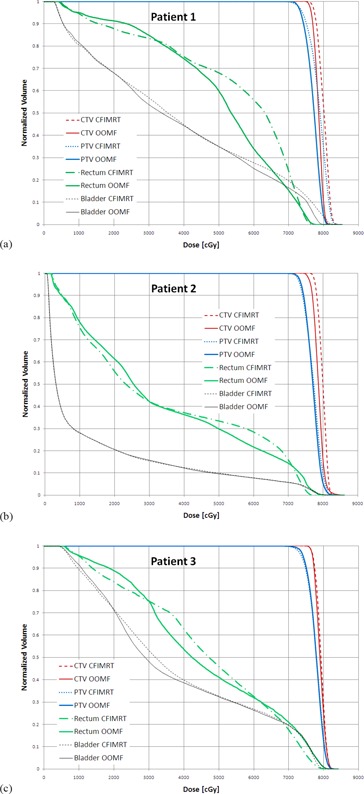
Dose‐volume histograms for CTV, PTV, rectum, and bladder obtained using the CFIMRT and OOMF techniques for patients 1, 2, and 3 are plotted in (a), (b), and (c), respectively.

Dose‐volume histograms for CTV, PTV, rectum, and bladder obtained using the CFIMRT and OOMF techniques for patients 1, 2, and 3 are plotted in (a), (b), and (c), respectively.