
Figure 4.
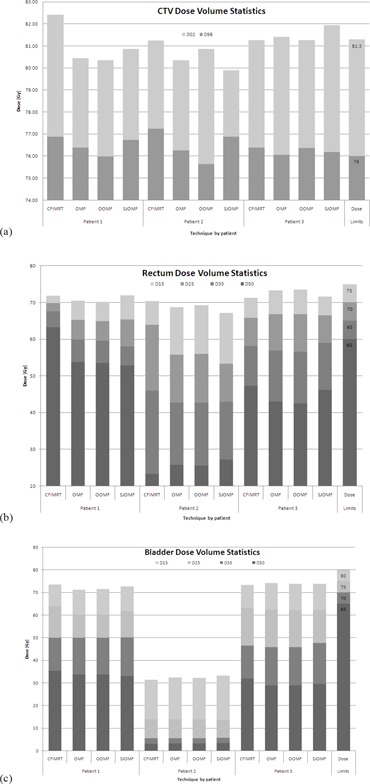
Dose‐volume statistics for each patient and technique investigated are represented for CTV (a), rectum (b), and bladder (c). The right‐hand column indicates the dose objectives used in‐house that are to be met by clinically acceptable plans.