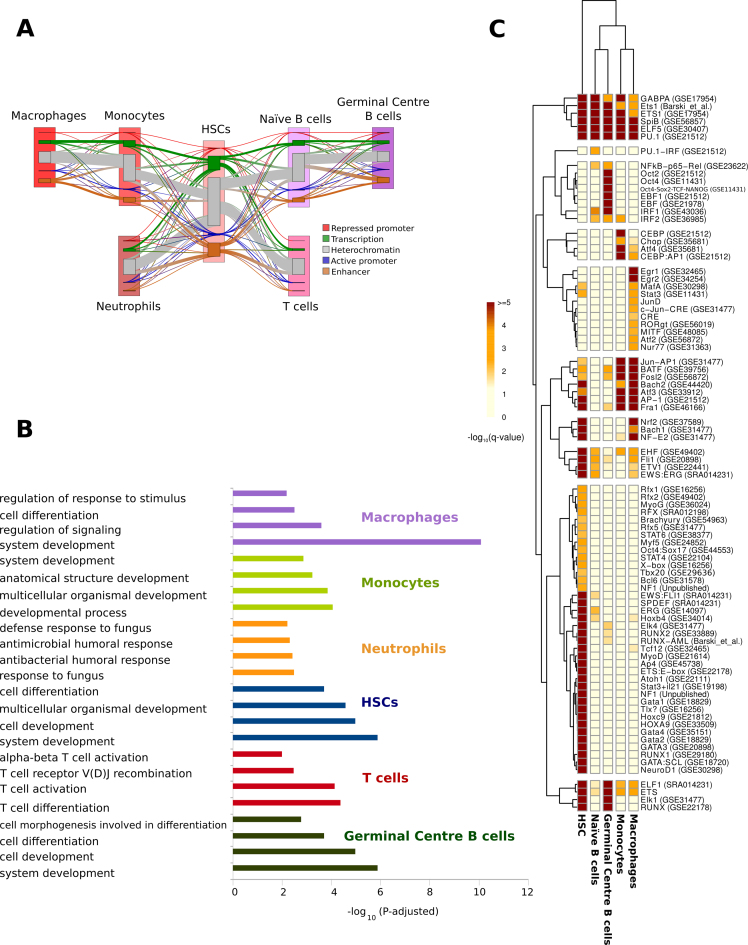
Figure 3.
Functional and transcription factor binding motifs characterization of chromatin determinant regions (CDRs). (A) Sankey Plot representation of chromatin state transitions at CDRs during hematopoietic cell differentiation. Nodes for each cell type represent the five ‘collapsed’ chromatin states (see ‘Materials and Methods’ section). For each pair of cell types in the hematopoietic differentiation pathway, flows, represented by line thickness, are proportional to the number of regions that show a transition between a particular pair of states. Changes in chromatin states between two stages of differentiation are shown with lines that change color. The thickness of the lines is proportional to the number of regions that show a transition between a particular pair of states. (B) Enriched ontology terms from the genes related to the CDRs that characterize each cell type. (C) Heatmap and hierarchical clustering based on transcription binding proteins enriched in the CDRs that characterize each cell type (see ‘Materials and Methods’ section). See also Supplementary Figures S3–15, Tables S2–6 and File S1.

