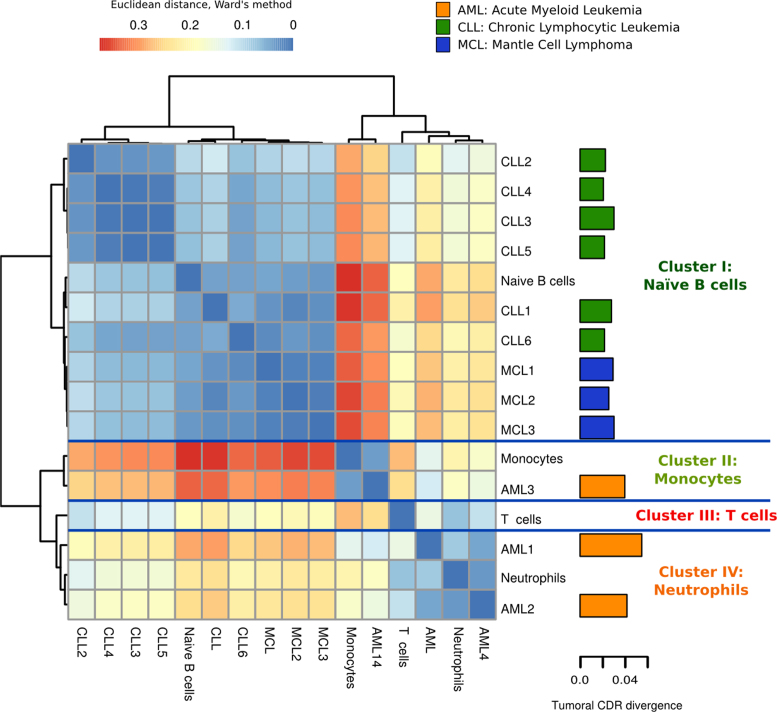
Figure 4.
Hierarchical clustering of leukemias based on CDRs of healthy cell types suggests potential lineage origin of tumors. The healthy cell type clusters are summarized by each fingerprint, a reference sample representing each cell type cluster. The euclidean distances between samples and fingerprints are calculated with the Ward's method. The barplot in the right shows the epigenomic divergence (ratio of chromatin changes in CDRs) of each cancer sample to the healthy states. See also Supplementary Figures S16–20 and Tables S7–9.

