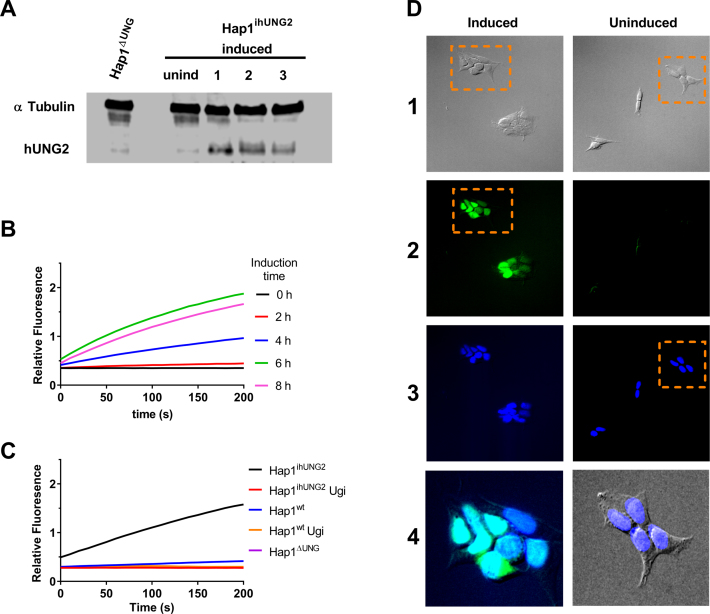
Figure 2.
Characterization of the Hap1ΔUNG and inducible Hap1ihUNG2 cell lines. (A) Western blot analyses of hUNG2 expression in the Hap1ΔUNG and the inducible Hap1ihUNG2 cell line at 16 h post induction using 1 μg/ml of doxycycline (see Supplemental Methods). The three numbered lanes are extracts obtained from three distinct clonally-expanded Hap1ihUNG2 cell lines, generated via transduction of Hap1ΔUNG with different concentrations of hUNG2 gene carrier lentivirus; all of the experiments in this paper were performed with cell line 2. (B) The time course for induction of hUNG2 activity in the inducible strain Hap1ihUNG2 was determined from cell extracts obtained at various times after induction. A robust continuous fluorescence activity assay was employed (see methods). Induction with 1 μg/ml of doxycycline resulted in robust hUNG2 expression that leveled off at about 6 h post-induction. All traces are the average of triplicate biological measurements. (C) Uracil excision activity in cell extracts arises solely from hUNG2. Extracts were obtained from the Hap1ihUNG2 cell line at 6 h post-induction and also the Hap1wt and Hap1ΔUNG cell lines. Ten micrograms of total cell protein was used in each assay. The continuous fluorescence assay employs the HP18 DNA substrate (see Supplemental Information). All traces are the average of triplicate measurements. The observed activity was completely inhibited by the inclusion of 2 μM uracil DNA glycosylase inhibitor protein (UGI), which is highly specific for hUNG2. (D) The nuclear compartment comprises at least 50% of the volume of Hap1 cells and overexpressed hUNG2 is localized to the nucleus. The Hap1ihUNG2 cell line was induced with 1 μg/ml doxycycline for 6 h prior to fixing and specific staining for hUNG2 (see Supplemental Methods). Non-induced Hap1ihUNG2 cells were stained using the same procedure. The vertical numbered panels are (1) transmitted light images, (2) hUNG2 immunofluorescence staining with Alexa 488 detection, (3) DAPI staining of nucleus, and (4) zoomed merges of the indicated panel regions. Images in each panel were taken on Olympus fluorescence microscope under 20x magnification. The zoomed regions are (i) an overlay of the indicated DIC and DAPI stained images, where the DAPI channel brightness was linearly enhanced for easier visual assessment, and (ii) overlay of the DAPI and Alexa 488 channels. The brightness of both channels was linearly adjusted to demonstrate nuclear colocalization of both fluorescence signals.

