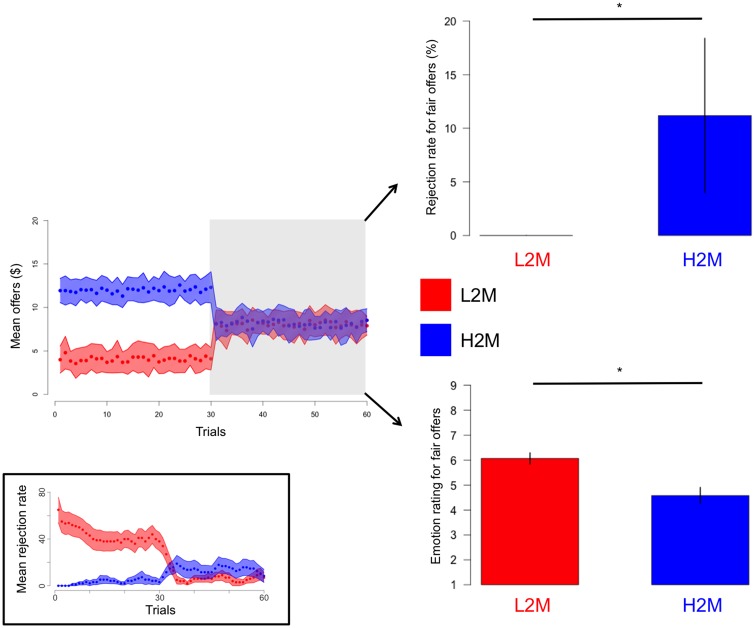
Fig. 3.
Behavioral effects of the norm adjustment task. Even if during the second half of the task the L2M (red) and H2M (blue) groups both received ‘fair’ offers, participants from the H2M group rejected significantly more and were significantly less happy about these ‘fair’ offers. The grey shaded area depicts the second half of the task from which the behavioral data were extracted. The blue and red shaded area represents±s.d. while error bars on the bar graphs represent SEM. There are no error bar for the rejection rate of the L2M group as all the participants in this group had a point estimate (median) rejection rate for ‘fair’ offers between 6$ and 10$=0%. Inset: Mean rejection rate for the low-to-medium (red) and high-to-medium (blue) groups. Individual rejection rates were calculated using a sliding window of 10 trials. The blue and red shaded area represents ± SEM. L2M: low-to-medium group; H2M: high-to-medium group; s.d.: standard deviation; SEM: standard error of the mean. *bootstrapping P <0.05.

