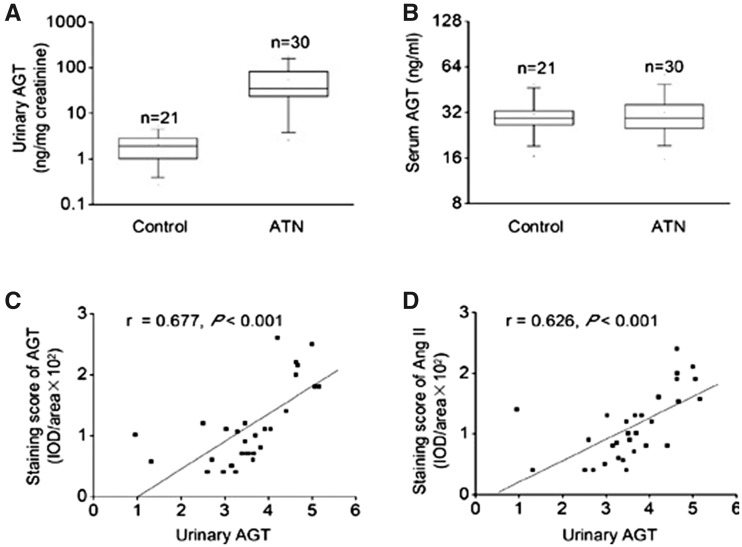
Fig. 4.
Expression of intrarenal RAS associated with uATG level in patients with ATN. (A) uAGT at the time of renal biopsy in patients with ATN and in healthy volunteers. (B) Serum angiotensinogen at the time of renal biopsy in patients with ATN and in healthy volunteers. (C) Correlation between intrarenal angiotensinogen expression and uAGT in patients with ATN. (D) Correlation between intrarenal Ang II expression and uAGT in patients with ATN. t-test, *P < 0.05 versus healthy volunteers in (A) and (B). Pearson correlation, *P < 0.05 in (C) and (D). Figure adapted with permission from Cao et al. [67].

