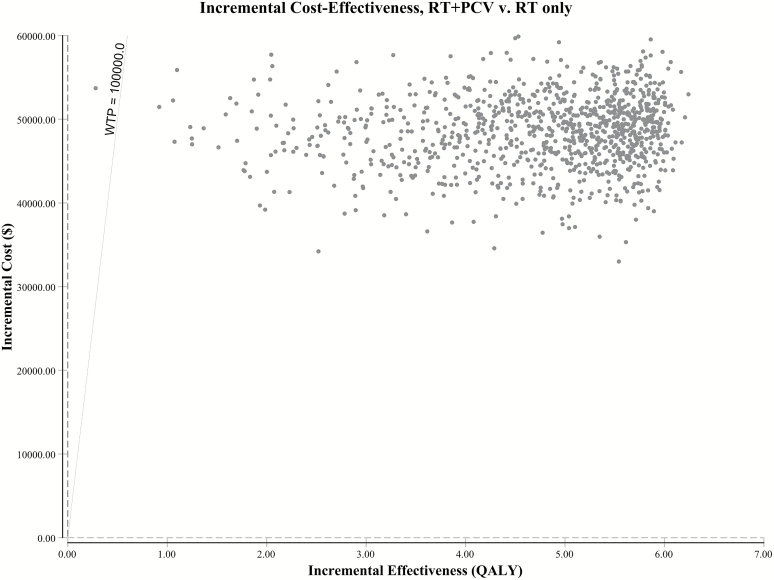
Fig. 2.
Incremental cost-effectiveness scatterplot of 10 000 Monte Carlo simulations shows 99.96% probability of cost-effectiveness at WTP threshold of $100 000 per QALY gained. Scatterplot data-points correspond to simulated incremental cost-effectiveness ratios expressed as $ per QALY gained. Abbreviations: QALY, quality adjusted life years; RT, radiotherapy; PCV, procarbazine, lomustine, vincristine.

