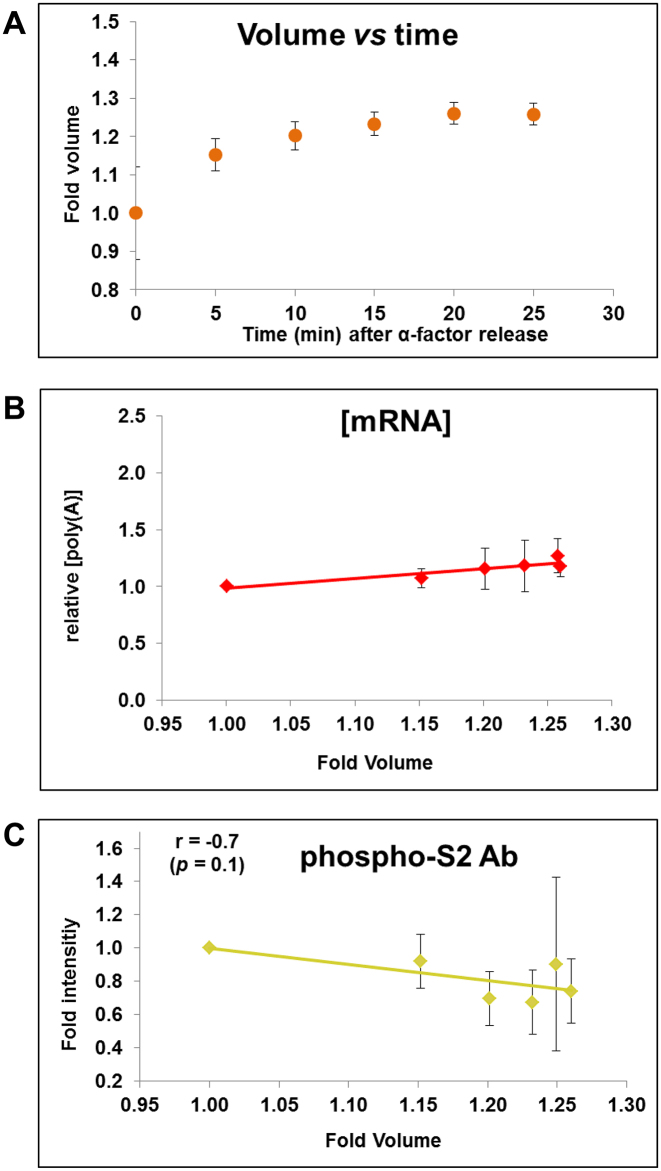
Figure 3.
Ribostasis and proteostasis analysis in synchronized cells. We performed a similar experiment to that of Eser et al. (36) (Figure 2) by making a α-factor synchronization of yeast cells (see text for details) and we measured cell volume (A) and [mRNA] (B) at different times after α-factor release. [mRNA] was calculated as the poly(A) amount per cell (divided by cell volume) by an assay based on fluorescent oligo-d(T) hybridization and cytometry quantification. Equal protein amounts were used in Western blot analyses for RNA pol II quantification with the phospho-S2 antibody, which measures elongating RNA pol II (C). Four independent biological replicates were used to calculate the average and standard deviation (SD) values. Total [RNA] and [protein] from the same samples are seen in Supplementary Figure S2A and B. A representative Western blot is shown in Supplementary Figure S2C. The levels of the total and elongating RNA pol II were normalized against the internal glucose 6-phosphate dehydrogenase (G-6-PDH) control.

