Figure 3.
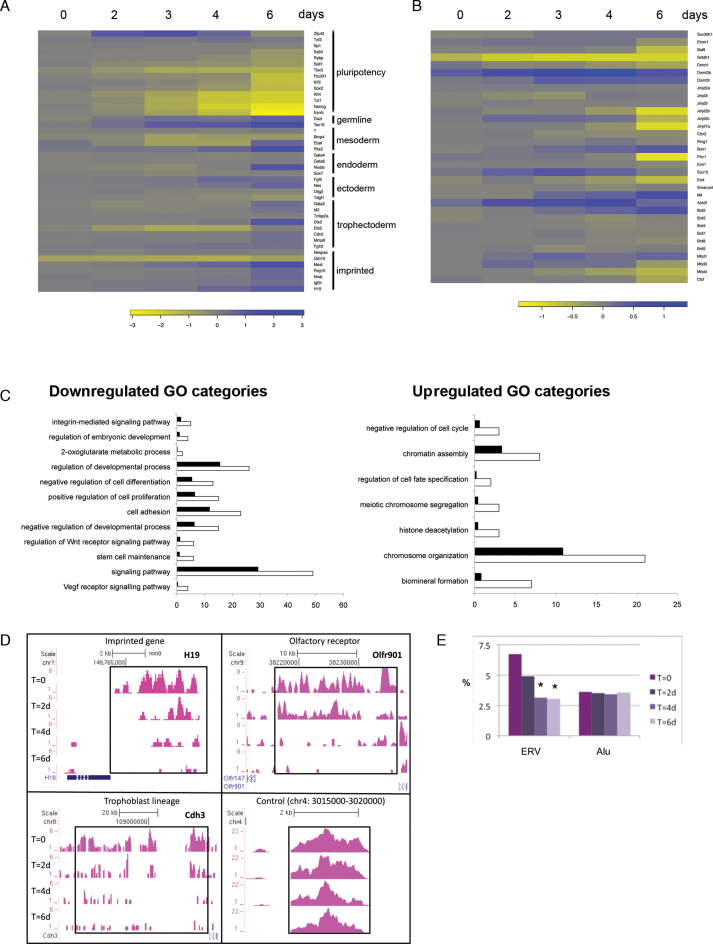
Timecourse analyses of gene expression and H3K9me3 histone modification marks in inducible conditional Setdb1 tm1c/tm2 mutant ES cells compared to control Setdb1 tm1c/+ ES cells following 4′OHT treatment and conversion of the conditional tm1c allele to the null tm1d allele. (A) Heatmap of changes in gene expression of pluripotency associated genes, lineage markers and imprinted genes by DNA microarray, following Setdb1 ablation. (B) Heatmap shows complex changes in expression of chromatin and epigenetic factors, in Setdb1 null ES cells. Key to log-fold-change values are below each heatmap. Negative values, indicating downregulation in Setdb1 null ES cells, are shown in yellow; positive values, indicating upregulation in Setdb1 null ES cells, are shown in blue. (C) GO Biological Processes analysis of up- or downregulated genes at a single timepoint early after Setdb1 ablation in ES cells. Categories enriched in Setdb1 tm1d/tm2 mutant versus +/tm1d control ES cell gene expression datasets after a 2-day 4′OHT treatment (same datatset as day 2 in heatmaps) are shown. White bars represent the number of genes observed while black bars represent the number of genes expected by chance in each GO category (P < 0.02). (D) ChIP-seq H3K9me3 profiles at selected loci in Setdb1 tm1c/tm2 mutant ES cells at timepoints before and following a 48 h 4′OHT treatment. T = 0, untreated cells at start of timecourse; T = 2d/4d/6d, 2/4/6 days after start of 4′OHT treatment. (E) The percentage of reads present on endogenous retrovirus repeats (ERVs) or Alu repeats during the same timecourse as in (D), * indicates sample significantly different to T = 0 sample, P < 0.01 (Fisher’s Exact test) with the additional requirement of >1.5-fold change between the profiles.

