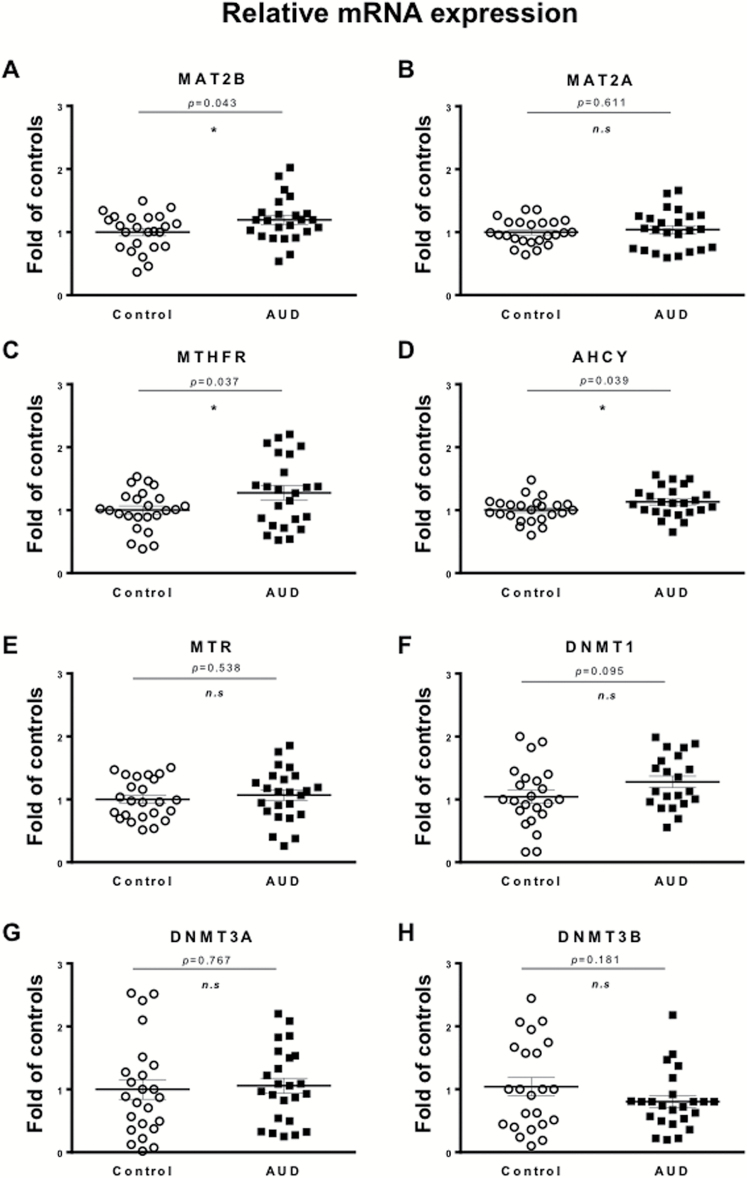
Figure 3.
Chronic ethanol intake increases expression of key enzymes of the 1-carbon metabolism in cerebellum. mRNA levels of (A) methionine adenosyltransferase (MAT) 2B, (B) MAT2A, (C) methylenetetrahydrofolate reductase (MTHFR), (D) adenosyl homocysteine hydrolase (AHCY), (E) methionine synthase (MTR), and (F–H) DNA methyltransferase (DNMT) 1, 3A, and 3B, respectively, are expressed as fold change of controls. Values are mean ± SEM of 24 samples per group with exception of DNMT1, where only 21 samples per group were measured. *P < .05, Student’s t test vs controls.

