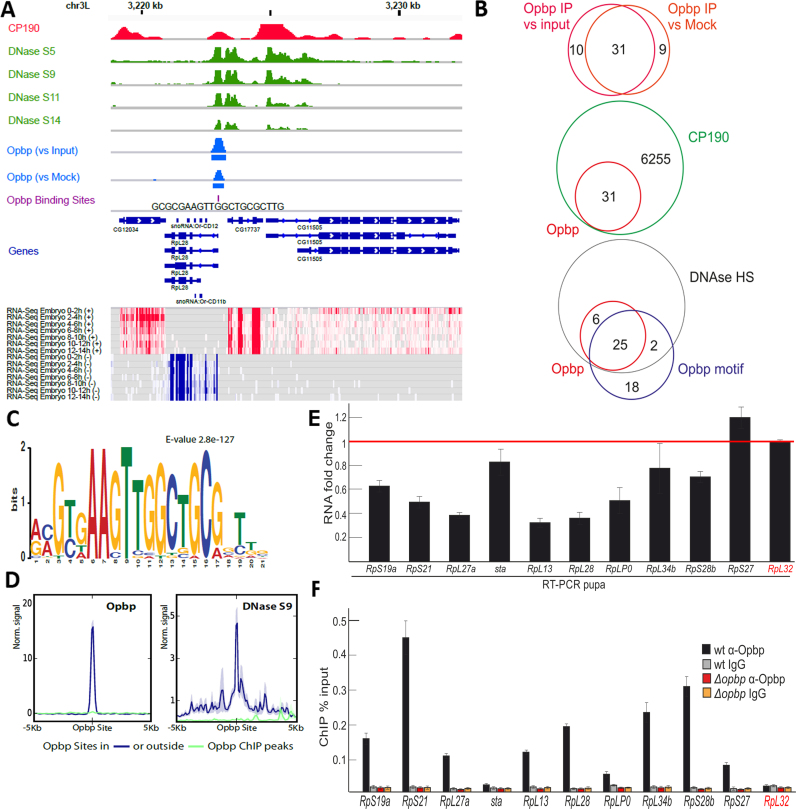
Figure 2.
Opbp binds to a restricted number of genomic loci via a specific motif. (A) Opbp binding at a representative locus showing Opbp IP signal scaled to library size and normalized to input or mock IP (middle blue tracks, rectangles indicate MACS2 peaks at 5% IDR) together with DNase hypersensitivity at embryonic stages 5, 9, 11 and 14 from (57) (green tracks), CP190 binding from (59) (red track), Opbp Binding Sites (violet track, Patser predictions), Transcript models (Flybase 5.57) and heatmaps of RNA-seq embryonic time course (total RNA from modENCODE (76)) for sense (red) and antisense (blue) strands. (B) Overlap between Opbp ChIP peaks, reported by MACS2, when contrasting Opbp IP with Mock versus input (upper Venn) at an IDR cutoff of 5%. Overlap between Opbp and CP190 bound regions (middle Venn) and Opbp bound regions with DNAse hypersensitivity sites and Opbp motifs. (C) Opbp motif discovered by MEME. (D) Opbp binds exclusively to regions containing its motif and in open chromatin. The quantitative ChIP signal for Opbp (mean profiles of normalized signal) centered around the Opbp motif for bound (blue) and unbound (green) sites. DNase hypersensitivity (embryonic stage 9, right) centered at all Opbp binding sites at Opbp-bound (blue) or unbound (green) regions. Semi-transparent ribbons around profiles show standard errors. (E) Expression levels of the ribosomal protein genes with the Opbp-bound promoter regions at pupae 2d stage in the wt and opbp− backgrounds. Individual transcript levels were determined by RT-qPCR with corresponding primers normalized relative to RpL32 (marked by red) for the amount of input cDNA. Histogram shows the changes of mRNAs for tested ribosomal protein genes comparing with expression levels in the wild type pupa (corresponding to the red line at the ‘1’ on the scale). Error bars show standard deviation of triplicate PCR measurements. (F) Comparing binding of Opbp to the promoters of the ribosomal protein genes in the wt and opbp− (Δopbp) background. Histogram shows ChIP enrichments at the promoter regions on chromatin isolated from wild type (wt) and Δopbp pupa with antibodies against Opbp and non-specific IgG. The results are presented as a percentage of input genomic DNA. Error bars show standard deviations of triplicate PCR measurements for three independent experiments. RpL32 (marked by red) is the negative control negative controls for Opbp binding.

