Fig. 7.

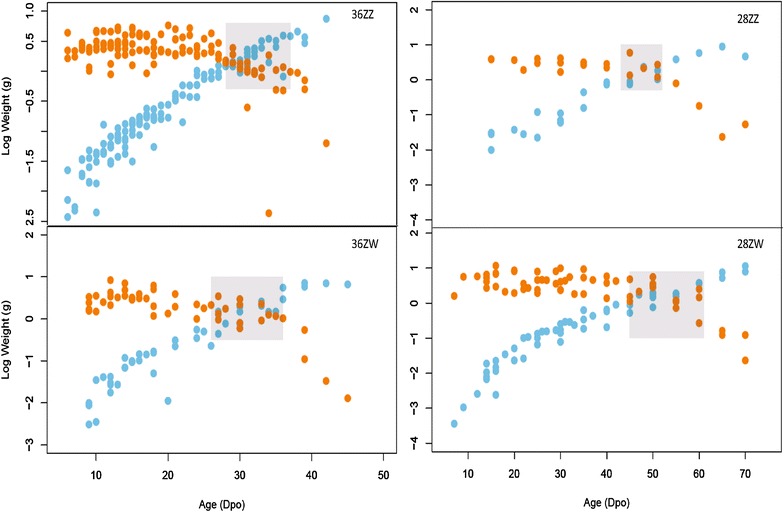
Log embryo (blue) vs. log yolk (orange) weight over time in days post-oviposition (dpo) for each treatment. Shaded rectangle highlights the time at which embryo weight rapidly increases at the expense of yolk weight

Log embryo (blue) vs. log yolk (orange) weight over time in days post-oviposition (dpo) for each treatment. Shaded rectangle highlights the time at which embryo weight rapidly increases at the expense of yolk weight