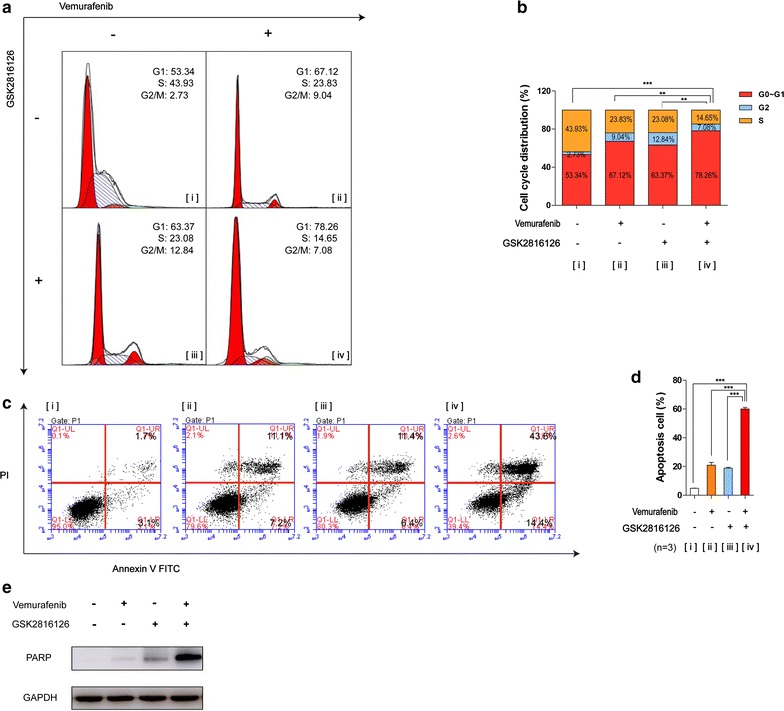
Fig. 4.

Variations in cell cycle distributions and apoptosis rates in cells after combination therapy. Combined treatment induced obvious G1 phase cell cycle arrest and apoptosis. a A2058 cells were treated with indicated concentrations of combination therapy and monotherapy for 48 h and subsequent to PI staining and flow cytometry analysis. b Graphs of the analysis were shown. The results were presented as mean ± SD (n = 3) (*P < 0.05; **P < 0.01; ***P < 0.001). c A2058 cells were treated with indicating concentrations of combination therapy and monotherapy for 24 h. Apoptotic cells were detected with Annexin V-FITC and PI double staining followed by flow cytometry analysis. d Graphs of the analysis were shown. Mean ± SD (n = 3). [i] Control, [ii] monotherapy with vemurafenib, [iii] monotherapy with GSK126, [iv] combination therapy. e Immunoblots was conducted to determine the protein levels of PARP. GAPDH serves as loading control
