
Fig. 5.
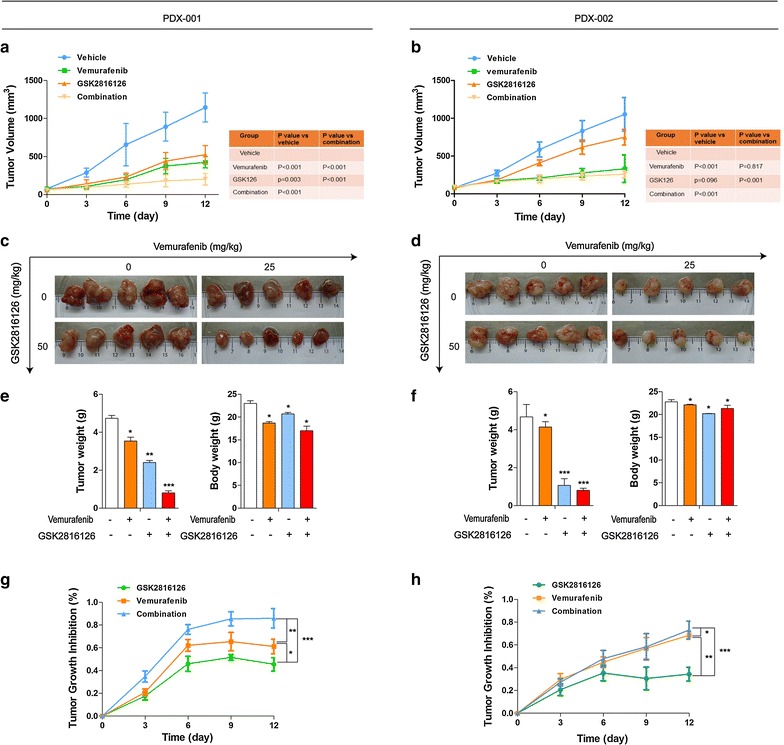
Therapeutic effects of combination of EZH2 and BRAF inhibition in vivo. When the tumor size reached approximately 600 mm3, PDX models mice (n = 5) were treated with buffer control, monotherapy and combination therapy daily. Tumor volume was evaluated as [length × width2] × 0.5 and presented as mean ± SD. Tumor size (a, b), tumor volume (c, d), tumor images (e, f) tumor weight and body weight (g, h). Tumor growth inhibition rate. %TGI (tumor growth inhibition) = 100(1 − Wt/Wc); Wt is the mean or median tumor volume of the treated group on day X; Wc is the mean or median tumor volume of controls on day X. The statistical significance of the growth curves (as compared to vehicle group) was evaluated by Mauchly’s test of sphericity (*P < 0.05; **P < 0.01; ***P < 0.001). a, c, e, g PDX 001; b, d, f, h PDX 002