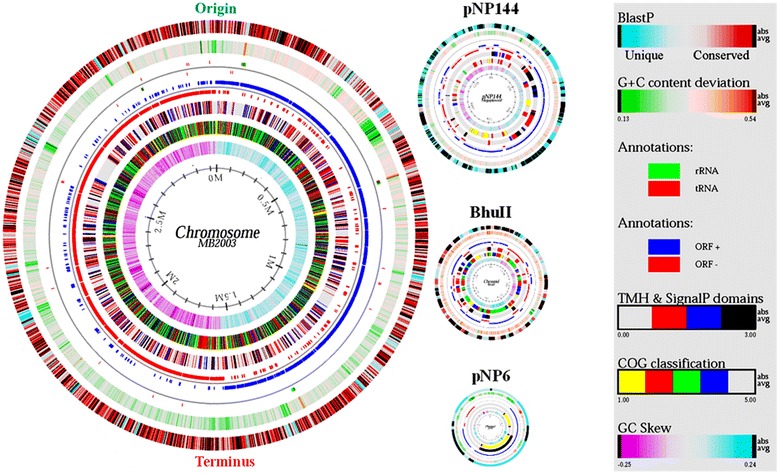
Fig. 5.

Genome atlas for B. hungatei MB2003. The figure represents a circular view of the four replicons that make up the B. hungatei MB2003 genome. The key at the right describes the concentric circles within each replicon in the outermost to innermost direction. The diagram was created using GENEWIZ [66] and custom-developed software. The innermost circle 1 shows GC-skew; Circle 2 shows COG classification: predicted ORFs were analysed using the COG database and grouped into the five major categories: yellow, information storage and processing; red, cellular processes and signalling; green, metabolism; blue, poorly characterised; and uncoloured, ORFs with uncharacterized COGs or no COG assignment. Circle 3 shows transmembrane helices (TMH) and SignalP domains: the four categories represent, uncoloured, absent; red, TMH; blue, SignalP; and black, both TMH and SignalP present. Circle 4 shows ORF orientation: ORFs in sense orientation (ORF+) are shown in blue; ORFs oriented in antisense direction (ORF-) are shown in red. Circle 5 shows ribosomal machinery: tRNAs and rRNAs are shown as green or red lines, respectively. Clusters are represented as coloured boxes to maintain readability. Circle 6 shows G + C content deviation from the average: GC-content is shown in either green (low GC spike) or orange (high GC spike). A box filter was applied to visualize contiguous regions of low or high GC deviations. Circle 7 shows BLAST similarities: deduced amino acid sequences were compared against the nonredundant (nr) database using gapped BLASTP [67]. Regions in blue represent unique proteins in MB2003, whereas highly conserved features relative to sequences in the nr database are shown in red. The degree of colour saturation corresponds to the level of similarity. The predicted origin and terminus of DNA replication are indicated
