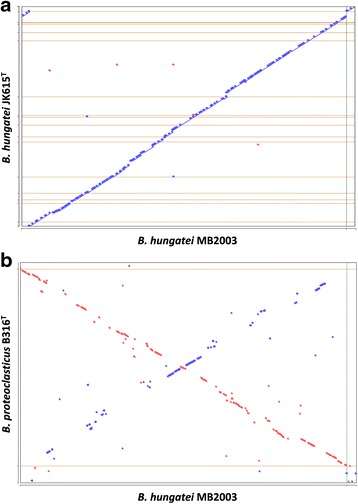
Fig. 6.

Genome synteny analysis. Alignment of the B. hungatei MB2003 genome against the draft genome of B. hungatei JK615T (a) and the complete genome of B. proteoclasticus B316T (b). Whenever the two sequences agree, a colored line or dot is plotted. If the two sequences were perfectly identical, a single line would go from the bottom left to the top right. Units displayed in base-pairs. Color codes: blue, forward sequence, red, reverse sequence
