Figure 10.
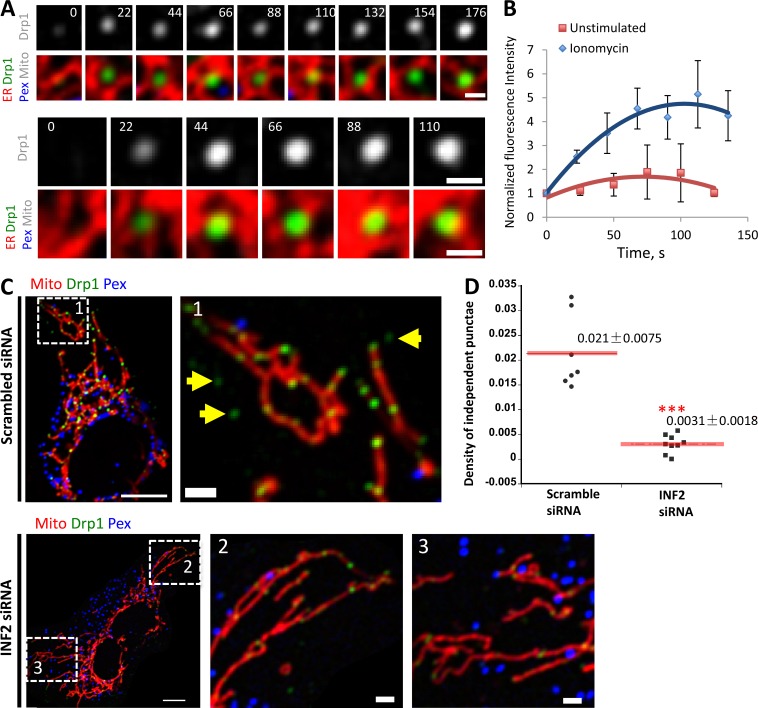
Maturation of existing independent Drp1 punctae upon ionomycin stimulation. (A) Two examples of independent Drp1 punctae maturation in response to ionomycin. Time-lapse images of live GFP-Drp1-KI cell as in Fig. 9 A. Time indicates seconds after ionomycin treatment. Fluorescence intensity levels modulated uniformly across time course so that final fluorescence is in linear range (resulting in time 0 fluorescence being undetectable as displayed). Bars, 1 µm. Time in seconds. (B) Quantification of mean independent Drp1 punctum intensity in unstimulated or ionomycin-treated conditions. Seven independent Drp1 punctae from unstimulated cells and eight independent Drp1 punctae from ionomycin-treated cells analyzed. Error bars, SD. (C) Effect of INF2 KD on independent Drp1 punctae in GFP-Drp1-KI cells transfected with mCherry-mito7 (mitochondria, red) and eBFP2-peroxisome (blue). Drp1 in green. Top, control siRNA; bottom, INF2 siRNA. Right, zoomed images of boxed regions indicated by numbers. Yellow arrows, independent Drp1 punctae. Bars: (left) 10 µm; (insets, right) 2 µm. (D) Quantification of independent Drp1 punctae density in control (scrambled siRNA) and INF2 siRNA cells. 174 independent punctae from seven control cells; 45 independent punctae from nine INF2 siRNA cells. Density expressed as number of independent Drp1 punctae per area of ROI (in square micrometers). ***, P < 0.001 by Student’s t test.

