Figure 3.
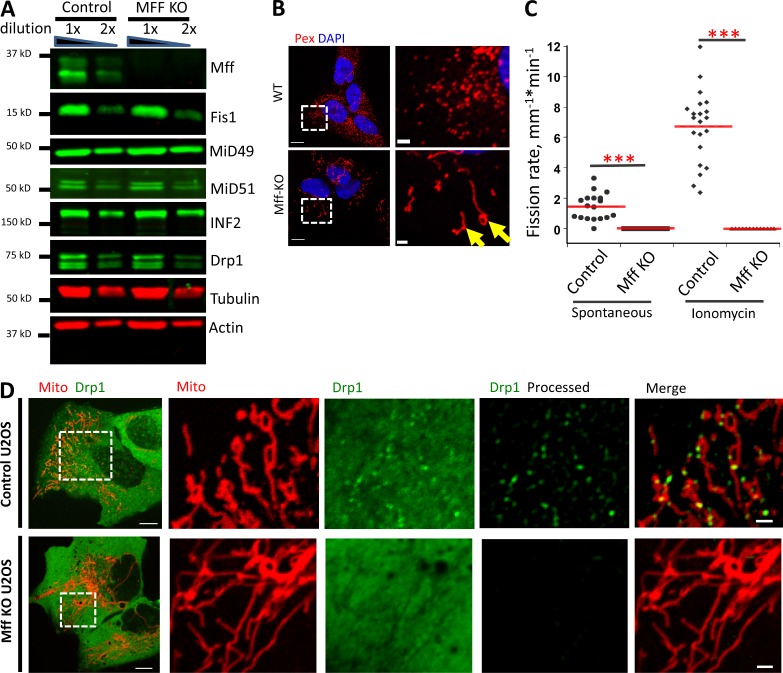
Mff KO U2OS cells are deficient in mitochondrial and peroxisomal division. (A) Western blotting for Mff and other mitochondrial division proteins in control and Mff KO U2OS cells. (B) Immunofluorescence of fixed cells stained for peroxisomes (red) and DNA (DAPI, blue). Images on right are zoomed regions. Yellow arrows indicate elongated peroxisomes in Mff KO cells. (C) Division rate quantification for both control and Mff KO U2OS cells. For the quantification of spontaneous division rate, 18 ROIs analyzed for either 12 (control) or 14 (Mff KO) cells. For quantification of ionomycin-induced division rate, 21 ROIs (control) and 13 ROIs (Mff KO) were analyzed. ***, P < 0.001 by Student’s t test. (D) Live-cell images of control (top) or Mff KO (bottom) U2OS cells transfected with GFP-Drp1 (green) and mito-RFP (red). Right panels show ROI of selected region (boxed). Raw images shown, except for the rightmost images, which are processed to reveal Drp1 punctae. Bars: (left) 20 µm; (right) 2 µm.

