Figure 2.
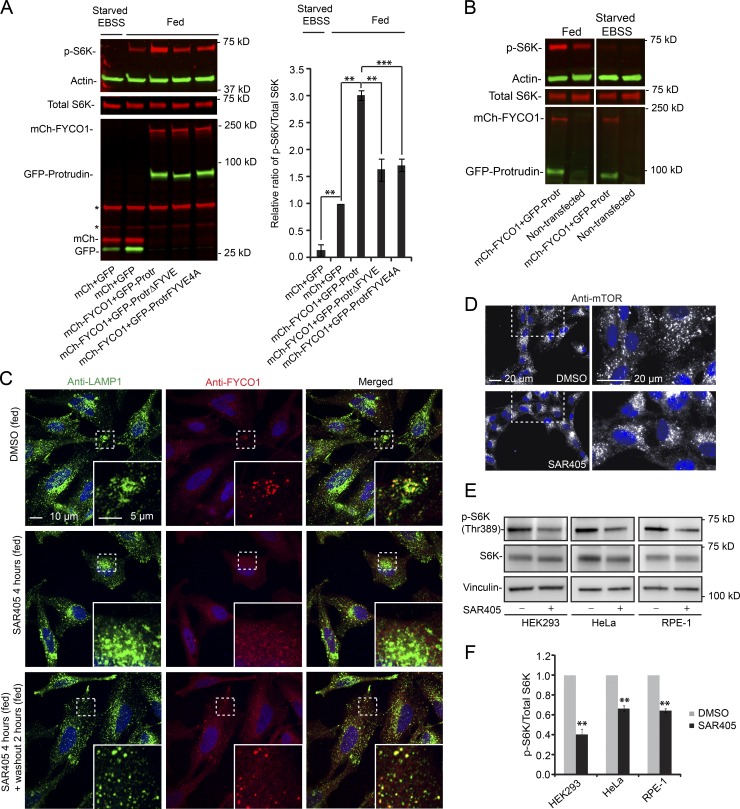
Protrudin and FYCO1 increase S6K phosphorylation in a PtdIns3P-dependent manner. (A) HeLa cells were transfected (40 h) with GFP–Protrudin WT, ΔFYVE, or FYVE4A in combination with mCherry–FYCO1 and analyzed by immunoblotting using antibodies specific to the proteins indicated. GFP and mCherry were used as controls. Where indicated, the cells were starved for 2 h with EBSS. Asterisks indicate unspecific bands from anti-mCherry. Graph shows quantification of immunoblots, representing the relative intensity of phospho-S6K normalized to the total amount of S6K in each sample. Error bars denote ± SEM from independent experiments (n = 3). **, P < 0.01; ***, P < 0.001 (Protrudin WT vs. mutants; unpaired t test; fed control set to 1 vs. starved control or fed Protrudin WT; one-sample t test). (B) HeLa cells were cotransfected (40 h) with GFP–Protrudin WT and mCherry–FYCO1 and analyzed by immunoblotting using antibodies specific to the proteins indicated. Nontransfected cells were used as controls. Where indicated, the cells were starved for 2 h with EBSS. The immunoblot is representative of three independent experiments. (C) HeLa cells were treated with 0.1% DMSO or 3 µM SAR405 for 4 h, before washout of SAR405 for 2 h (all treatments in complete medium), stained with antibodies against LAMP1 and FYCO1, and analyzed by confocal microscopy. (D) RPE-1 cells were treated with 0.1% DMSO or 3 µM SAR405 for 4 h (all treatments in complete medium), stained with an antibody against mTOR, and analyzed by wide-field microscopy. (E) HeLa, HEK293, and RPE-1 cells were treated with 0.1% DMSO or 3 µM SAR405 in complete medium for 4 h and analyzed by immunoblotting. (F) Quantification of immunoblots (as in E), representing the relative intensities of phospho-S6K normalized to the total amount of S6K in each sample. Error bars denote ± SEM from independent experiments (n = 3). **, P < 0.01 (one-sample t test).

