Figure 2.
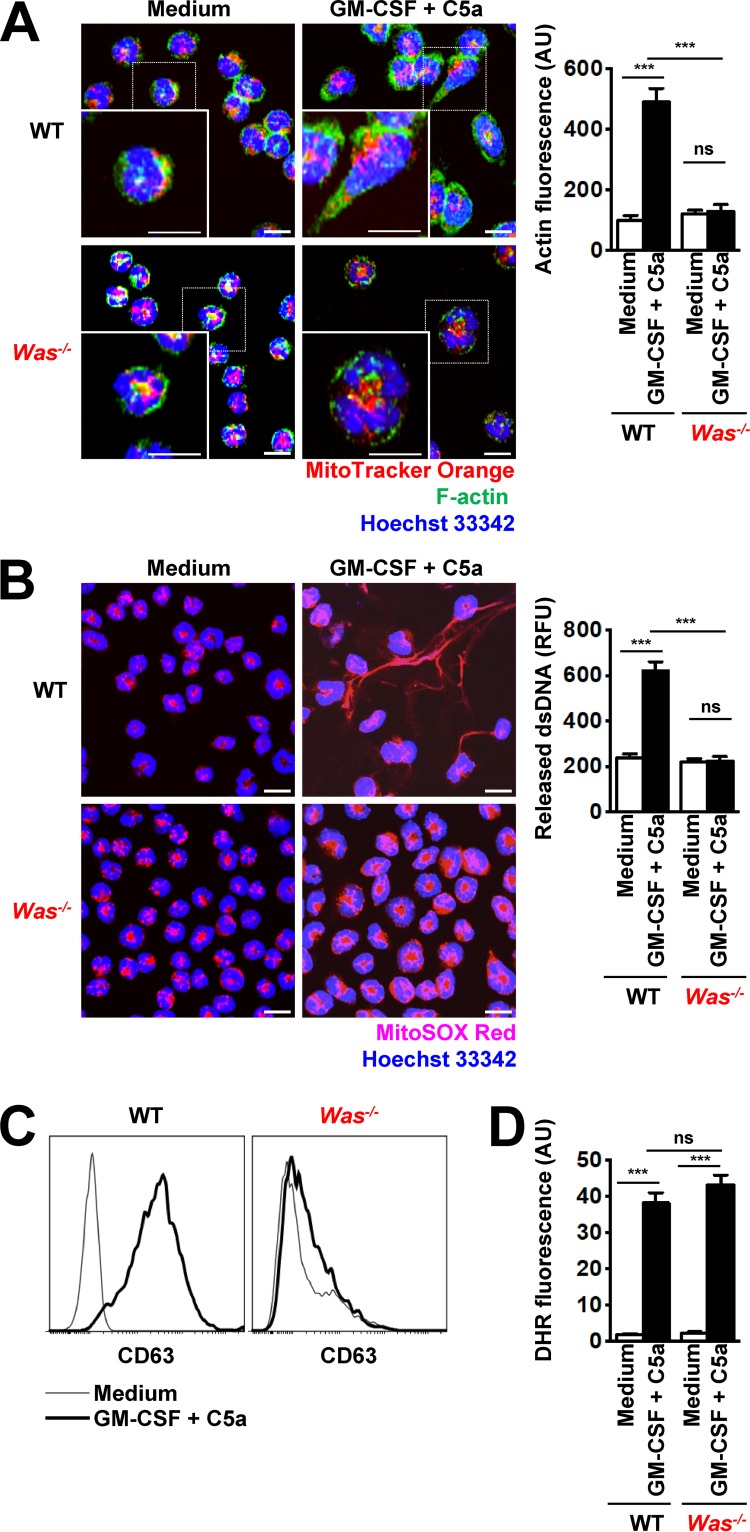
Was−/− mouse neutrophils exhibit defects in actin polymerization, degranulation, and DNA release. (A) Confocal microscopy. F-actin distribution and morphological changes were analyzed after short-term stimulation (total 35 min) of WT and Was−/− mouse neutrophils with the indicated triggers. Right: Quantification of F-actin was performed by automated analysis of microscopic images by using Imaris software. (B) Confocal microscopy. DNA release was analyzed after short-term stimulation (total 35 min) of WT and Was−/− mouse neutrophils, with the indicated triggers. Right: Quantification of released dsDNA in supernatants of activated neutrophils. (C) Flow cytometry. Expression of CD63 was assessed and short-term stimulation (total 35 min) of WT and Was−/− mouse neutrophils with the indicated triggers. Representative histograms are presented. (D) Flow cytometry. Total ROS activity of WT and Was−/− mouse neutrophils after short-term stimulation (total 35 min) with the indicated triggers was assessed by DHR123 fluorescence. Data are means ± SEM. ***, P < 0.001. n = 5. Bars, 10 µm.

