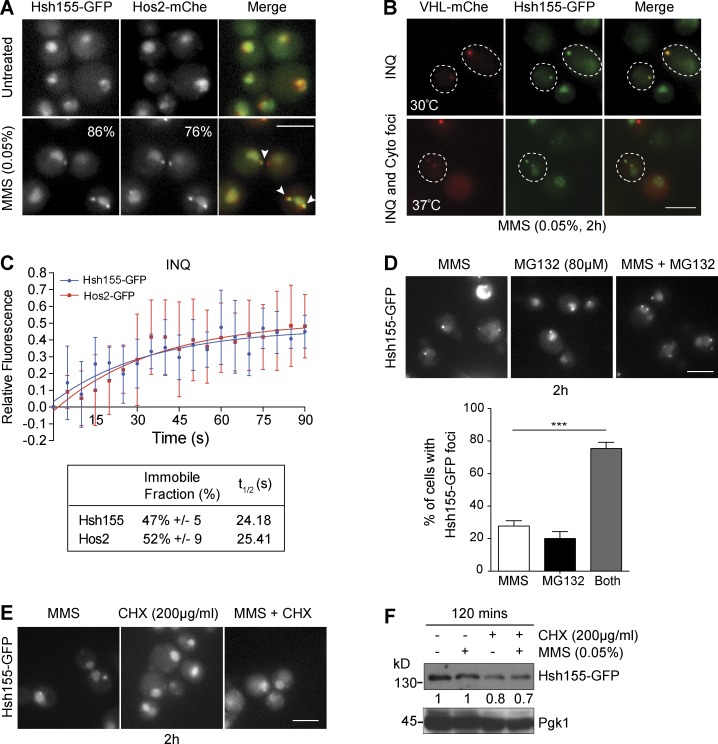
Figure 2.
Hsh155 relocalizes to nuclear (INQ) and cytoplasmic PQC sites. (A) Colocalization (white arrowheads in merge) of Hsh155-GFP with Hos2-mCherry (mChe) in MMS. The percentage of cells with foci is indicated in the corner of the bottom panels. (B) Colocalization of Hsh155-GFP with VHL-mCherry at both 30°C and 37°C with MMS. Dashed outlines indicate position of the cell body. (C) Quantitative FRAP analysis of GFP-tagged Hsh155 or Hos2 in nuclear foci. The top graph shows the best line of fit curve of relative fluorescence intensities over time for both Hsh155 (blue) and Hos2 (red); the bottom table shows the percentage of Hsh155 and Hos2 in the immobile fraction and diffusion time (t1/2). Error bars are means ± SD of Hsh155 (eight cells) and Hos2 (five cells) analyzed over three independent experiments. (D) Effect of proteasome inhibition by MG132 on Hsh155 aggregation. Representative images (top) and quantification (bottom) are shown. Means ± SEM; n = 3 with >100 cells each. ***, P < 0.001; Fisher’s test. (E) CHX blocks Hsh155 foci formation. Representative image of Hsh155-GFP–tagged cells treated with CHX (200 µg/ml) and MMS (0.05%). Bars, 5 µm. (F) Hsh155 protein levels in MMS by anti-GFP Western blotting relative to Pgk1 levels. Shown is the representative blot from four independent experiments.

