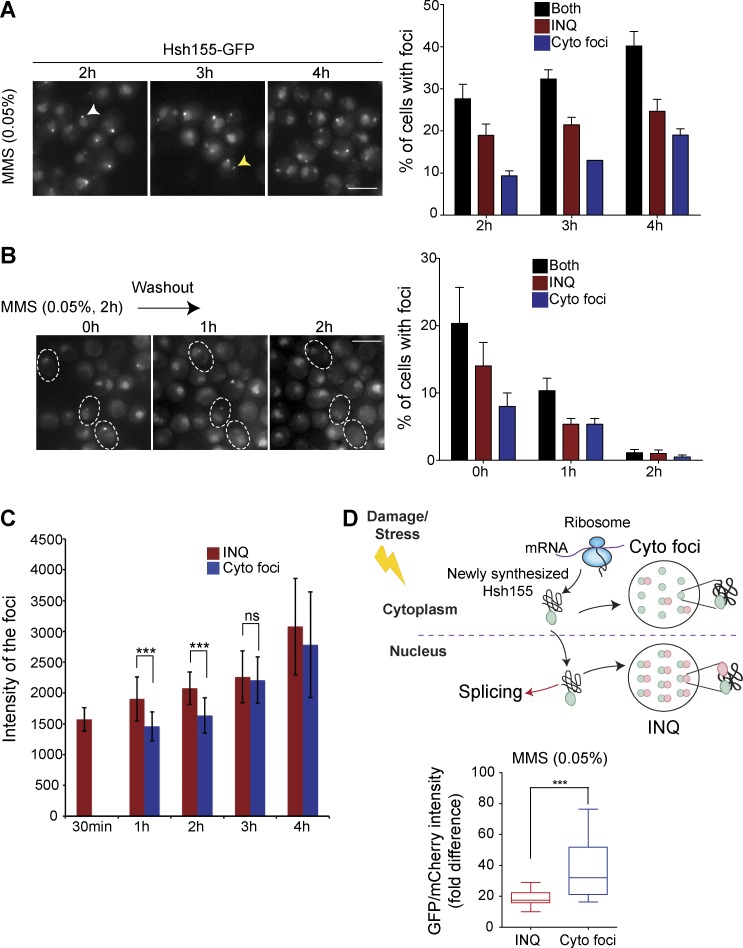
Figure 3.
Dynamic behavior of Hsh155 at PQC sites. (A and B) Time course imaging of Hsh155-GFP foci accumulation over time (A; the yellow arrowhead indicates a cytoplasmic focus, and the white arrowhead indicates a nuclear focus) and disappearance after MMS washout (B). Representative images are shown on the left, and quantifications of percentages of cells with Hsh155 foci are on the right. For B, dashed outlines represent time-lapse images of foci disappearance over time in the same set of cells. No claims of significance are made. n = 3 with >200 cells each. Bars, 5 µm. (C) Fluorescence intensity of foci over time show increasing relative GFP in cytoplasmic foci until 2 h of MMS treatment. (D) Tandem fluorescent fusion intensities of Hsh155 in aggregates. Ratios of GFP and mCherry fluorescence in nuclear or cytoplasmic foci are shown (bottom). A schematic of protein lifetime of Hsh155 fusion to a fluorescent timer in PQC (top), showing older (GFP>mCherry) protein in INQ and newer (GFP>>>mCherry) in cytoplasmic foci. For A–C, bars are color-coded to denote INQ (red), cytoplasmic foci (blue), or both (black). For C quantifications: n > 100; Student t test. For D quantifications: n ≥ 28 per replicate; Mann-Whitney test. Both C and D had three replicates; all error bars are means ± SEM. ***, P < 0.001.

