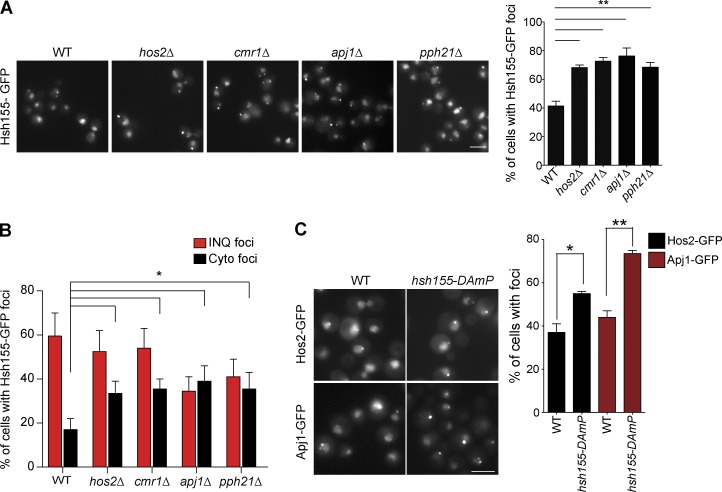
Figure 4.
Regulation of Hsh155 foci formation by INQ-resident proteins. (A) Representative images showing foci in MMS-treated cells (left). Quantification of percentage of cells with Hsh155 foci in indicated strains (right). (B) Effect of losing the indicated INQ residents proteins on INQ and cytoplasmic foci distribution. (C) Representative images showing effects of depleting HSH155 on INQ formation (left). Percentage of cells with Hos2 (black) and Apj1 (red) foci in the indicated strain (right). Bars, 5 µm. Error bars are means ± SEM; n = 3 with >50 cells each. *, P < 0.05; **, P < 0.01; Fisher’s test.

