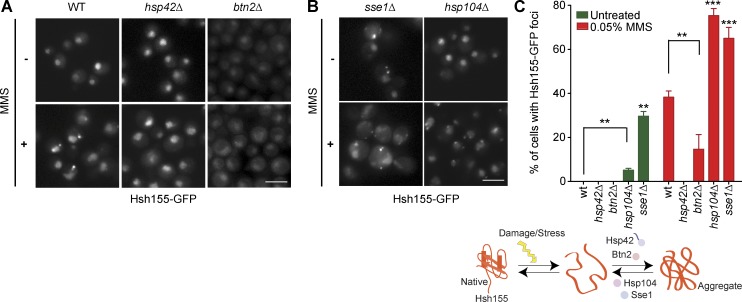
Figure 5.
Regulation of Hsh155 foci formation by molecular chaperones. (A and B) Effect of aggregases (A) and disaggregases (B) on Hsh155 relocalization in MMS relative to WT. Representative images are shown. Bars, 5 µm. (C) Summary of chaperone regulation of Hsh155 relocalization. Schematic (top) and quantification of cells with foci from A and B (bottom). Error bars are means ± SEM; n = 3 with >50 cells each. Asterisks show p-value thresholds in comparison with WT under the same condition. **, P < 0.01; ***, P < 0.001; Fisher’s test.

