Figure 6.
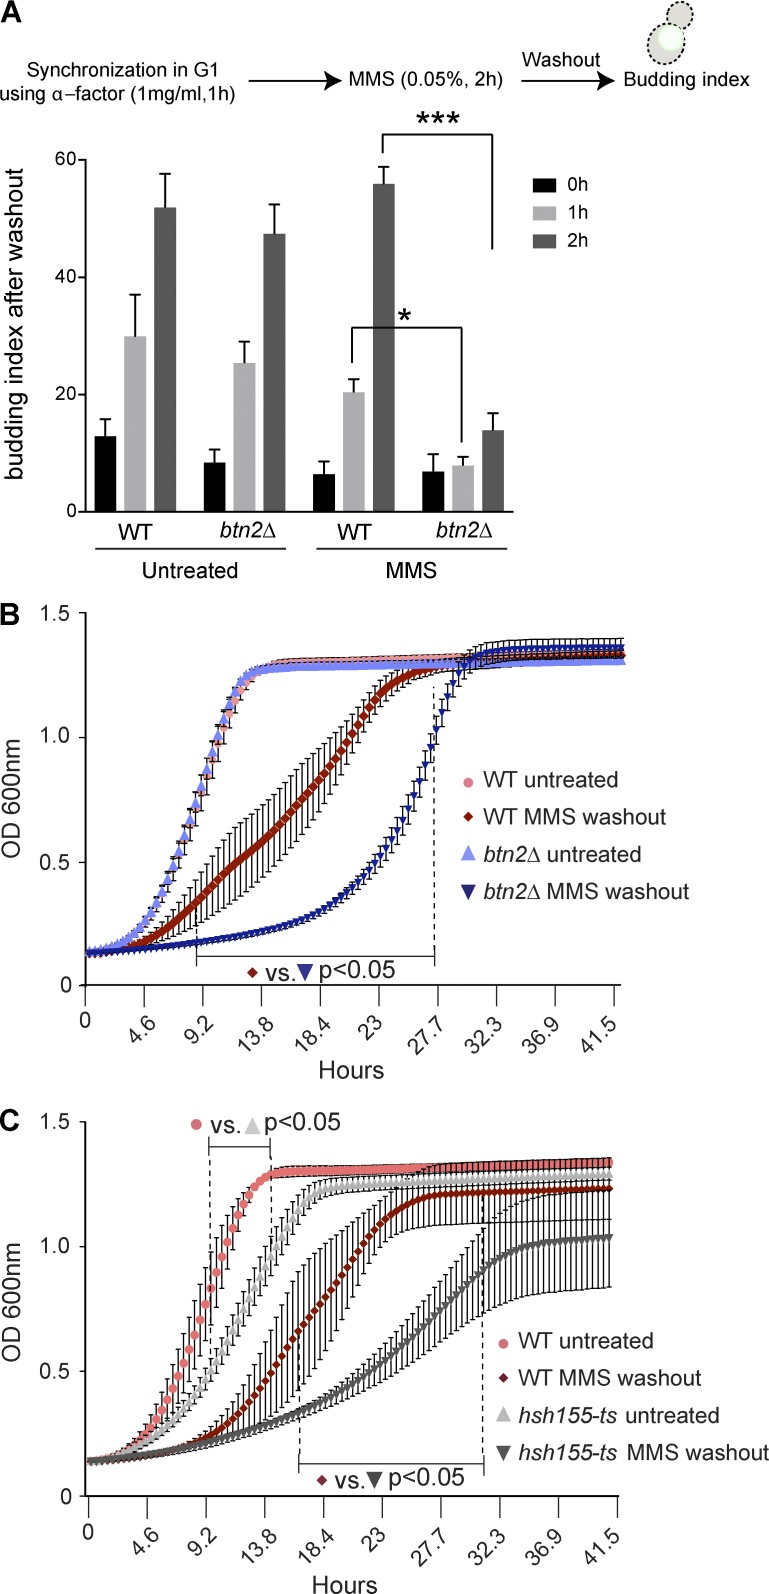
Hsh155 foci formation is crucial for efficient stress recovery. (A) Quantification of budded cells in strains synchronized and released from G1 phase ± MMS washout. n = 3 with >30 cells each. *, P < 0.05; ***, P < 0.001; Fisher’s test. (B and C) Growth curve analysis of btn2Δ (B) and hsh155-ts (C) alleles compared with WT strains ± MMS and 2 h after MMS washout at 30°C. The dotted line represents the range wherein all data points significantly differ from WT under the same conditions. n = 3 with triplicates in each. Means ± SEM; two-way ANOVA with Tukey’s post hoc test; p-values range from <0.05–<0.0001.

