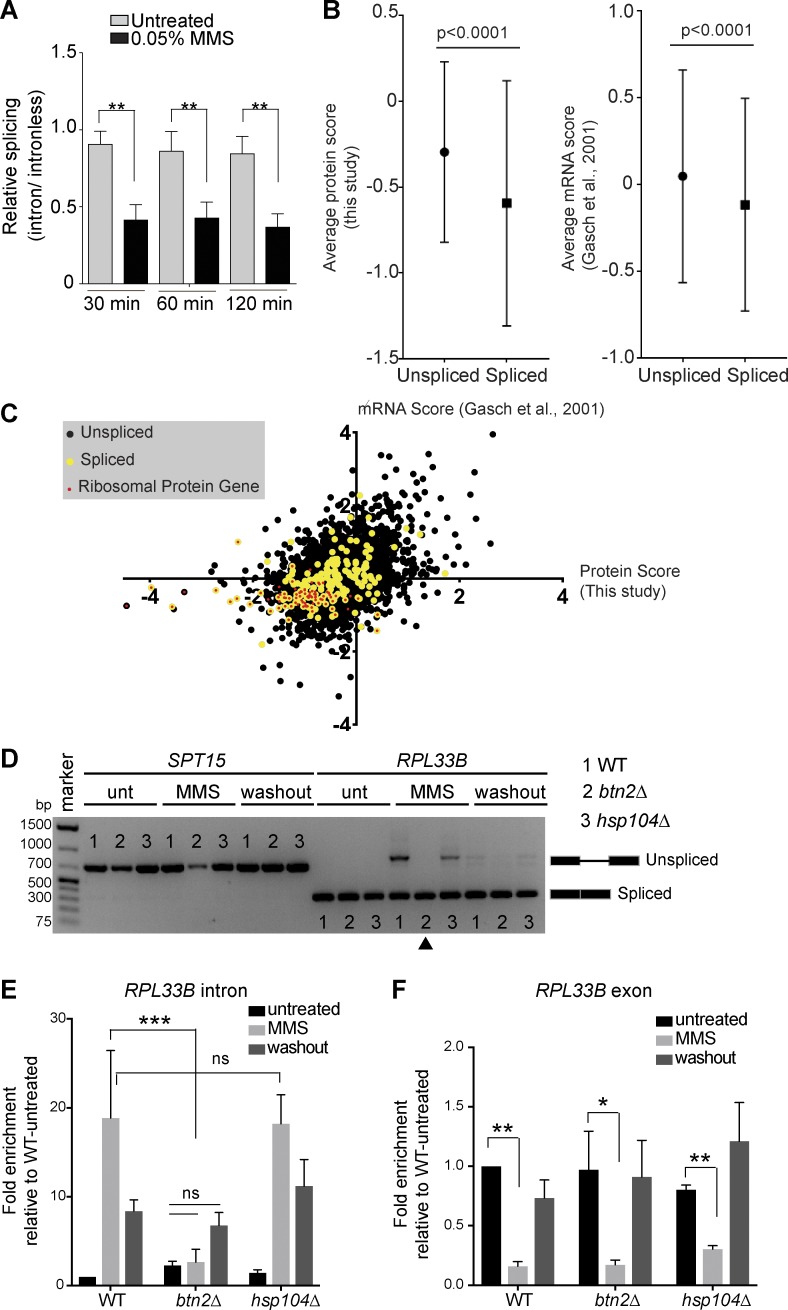
Figure 7.
Hsh155 sequestration influences RPG repression and splicing. (A) Splicing efficiency of a LacZ reporter in MMS. Quantification of relative LacZ splicing in untreated and MMS-treated normalized to “no intron” control. Student’s t test; n = 3 with individual transformants in triplicates each. (B) Comparison of the spliced gene subset from whole-proteome analysis by mass spectrometry (this study: 4,357 total, 3,864 no change, 75 enriched, and 418 depleted. 39 of the depleted proteins are spliced genes, and 35 are RPs) or microarray data (Gasch et al., 2001) after 2 h in MMS. Mann-Whitney p-value is <0.0001. (C) Scatterplot of proteome and mRNA data for each gene. Spliced genes are highlighted in yellow, and red dots indicate RPG products. Depleted and enriched proteins in our mass spectrometry analysis are listed in Table S2. (D) Hsh155 aggregate formation correlates with RPG intron retention in MMS. Expression and splicing of RPL33B transcripts compared with intronless SPT15 in WT, BTN2-, and HSP104-deleted strains with or without MMS and 2 h after MMS washout. cDNA PCR products representing spliced and unspliced are indicated. The arrowhead indicates the lack of MMS-induced intron retention in btn2Δ cells. Unt, untreated. (E) Quantification of RPL33B intron region in the indicated strains by reverse transcription–quantitative PCR normalized to SPT15 and relative to WT untreated. (F) Quantification of RPL33B mRNA transcript levels from exon region in WT, BTN2-, and HSP104-deleted strains by reverse transcription–quantitative PCR normalized to SPT15 and relative to WT untreated. Three biological replicates; means ± SEM; Asterisks show p-values of ΔΔCt levels. *, P < 0.05; **, P < 0.01; ***, P < 0.001; ANOVA.

