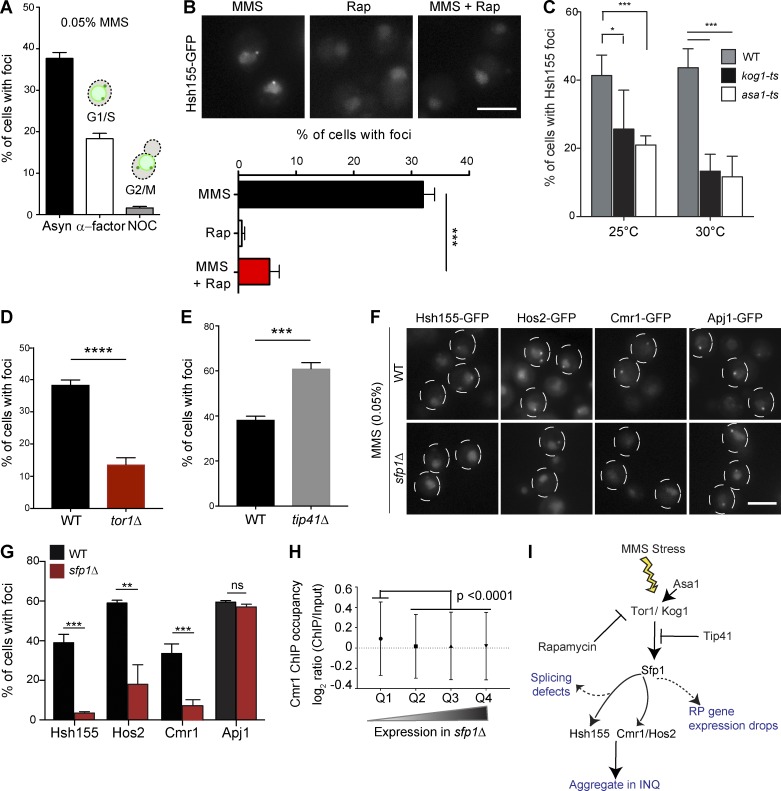
Figure 8.
TORC1 signaling influences sequestration of transcription regulators to PQC through Sfp1. (A) Cell cycle dependence of Hsh155 sequestration. Quantification of cells with Hsh155 foci in asynchronous (Asyn; black), G1 (α-factor; white) and G2/M (nocodazole [NOC]; gray) cells. (B) Rapamycin regulates Hsh155 foci formation in response to MMS. Representative images (top) and quantification (bottom). (C) Effect of ts mutants of TORC1 subunit Kog1 and regulator Asa1 on Hsh155 foci at 25°C and 30°C. (D and E) Opposing effects of TOR1 (D) or TIP41 (E) deletion on Hsh155 foci in MMS. (F) Sfp1 is required for Hsh155, Hos2, and Cmr1 relocalization but not for INQ formation. Representative images of Hsh155-GFP under the indicated conditions. Dashed circles denote two or three cell border outlines each per representative image. Bars, 5 µm. (G) Quantification of Hsh155 foci formation in sfp1Δ cells from F. Three replicates; n > 100; means ± SEM. *, P < 0.05; **, P < 0.01; ***, P < 0.001; ****, P < 0.0001. (H) Cmr1 occupancy at genes affected by sfp1Δ. Quartiles (Q1–Q4) were derived from microarray data in sfp1Δ (Marion et al., 2004) and the Cmr1 ChIP occupancy data in WT (all genes; n = 5,549; listed in Table S4; Jones et al., 2016). Cmr1 occupancy is highest in genes regulated by SFP1 (P < 0.0001; ANOVA with Tukey’s test). (I) Model of TORC1 pathway regulators tested in this study leading to INQ protein aggregation; see also Fig. 9 for integrated model.

