Figure 6.
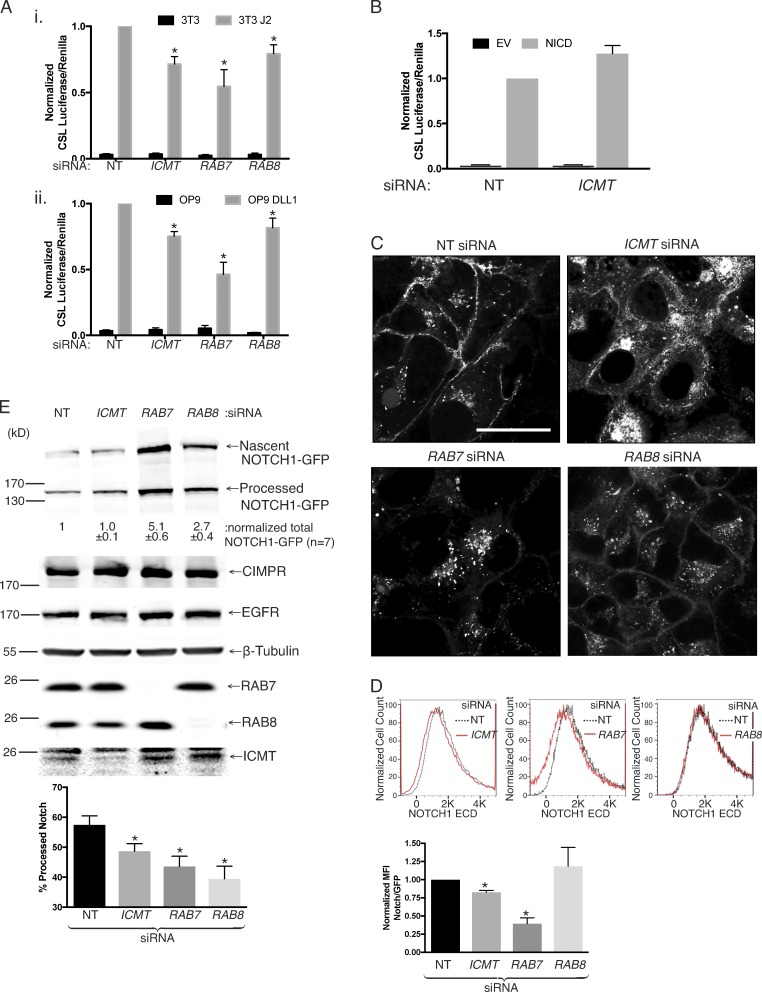
Silencing of ICMT, RAB7, or RAB8 alters the processing and subcellular localization of NOTCH1 and inhibits NOTCH signaling. (A) NOTCH signaling in U2OS cells quantified with a NOTCH-responsive CSL firefly luciferase reporter. Shown are the ratios of CSL firefly/CMV renilla in U2OS cells expressing NOTCH1-GFP cocultured with 3T3 (i) or OP9 (ii) fibroblasts expressing the NOTCH ligands Jagged 2 (J2) or DLL1, respectively. The cells were transfected with the indicated siRNAs 4 d before the luciferase reading. Values were normalized to the maximum firefly/renilla ratio in NT siRNA–treated cells and are given as means ± SEM. n = 7. (B) NOTCH signaling measured as in A in U2OS cells transfected with either empty vector or NICD. The values are normalized to the firefly/renilla measured in NT siRNA–treated cells expressing NICD. Data shown are means ± SEM. n = 3. (C) NOTCH-GFP–expressing U2OS cells were transfected with the indicated siRNAs for 4 d before imaging live by confocal microscopy. Representative images are shown. Bar, 10 µm. (D) Cytofluorometric analysis of surface NOTCH1-GFP by staining intact cells with or without the indicated 4 d siRNA knockdown with an antibody to the ectodomain of NOTCH1. Shown are representative histograms (X axis, linear fluorescence intensity) in the top panels and quantification of normalized mean fluorescence intensity values shown as means ± SEM (n = 3) in the bottom panel. (E) NOTCH1-GFP–expressing U2OS cells were transfected with the indicated siRNAs for 4 d before lysis and analysis by SDS-PAGE and immunoblot with the indicated antibodies. The values shown under the representative blot are means ± SEM of the total amount of NOTCH1-GFP (processed + nascent unprocessed) expressed in each condition normalized to β-tubulin (n = 7). Below is the amount of processed NOTCH1-GFP relative to the total expressed NOTCH1-GFP plotted as means ± SEM. n = 7. *, P < 0.05 (two-sided t test).

