Figure 8.
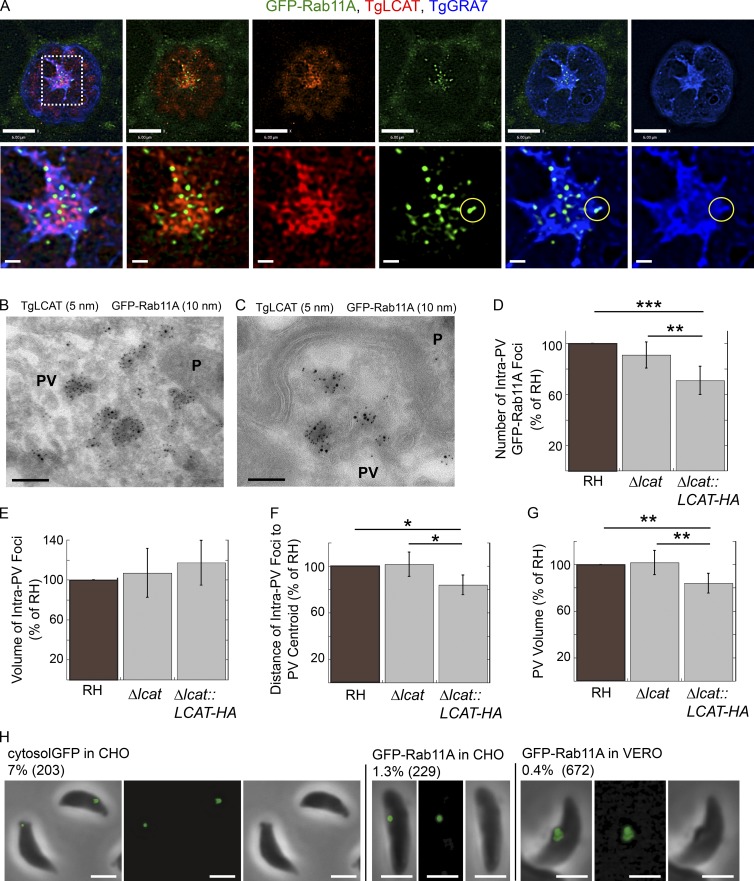
Distribution of TgLCAT relative to intra-PV host GFP-Rab11A vesicles. (A) GFP-Rab11A–expressing VERO cells (green) infected with Δlcat::LCAT-HA (24 h) were immunostained for HA (red) and TgGRA7 (blue). The yellow circle indicates an overlap of GFP-Rab11A and TgGRA7. Bars: 6 μm; (magnified views) 0.4 μm. (B and C) Double immuno-EM for GFP and HA of VERO cells expressing GFP-Rab11A and infected with Δlcat::LCAT-HA (24 h) showing codistribution. Bars, 100 nm. (D–G) GFP-Rab11A–expressing VERO cells infected with RH, Δlcat, and Δlcat::LCAT-HA parasites (24 h). The number (D), volume (E), and distance from the PV centroid (F) of intravacuolar GFP-Rab11A foci and the volume (G) of the PV were calculated. The data represent mean values ± SD, n = 6 independent experiments. Number of PVs measured: RH (24, 17, 8, 38, 38, and 35), Δlcat (14, 22, 10, 40, 41, and 31), and Δlcat::LCAT-HA (18, 16 7, 34, 33, and 38) *, P < 0.05; **, P < 0.01; ***, P < 0.0002. (H) CHO cells transiently expressing GFP (cytosol GFP) or GFP-Rab11A (24 h) or VERO cells stably expressing GFP-Rab11A were infected with Δcpl parasites for 24 h. Parasites were mechanically liberated from host cells and viewed by fluorescence microscopy. Shown are overlay, fluorescence, and phase contrast images. The percentage of parasites positive for staining is shown along with the number of parasites viewed. Bars, 2 µm.

