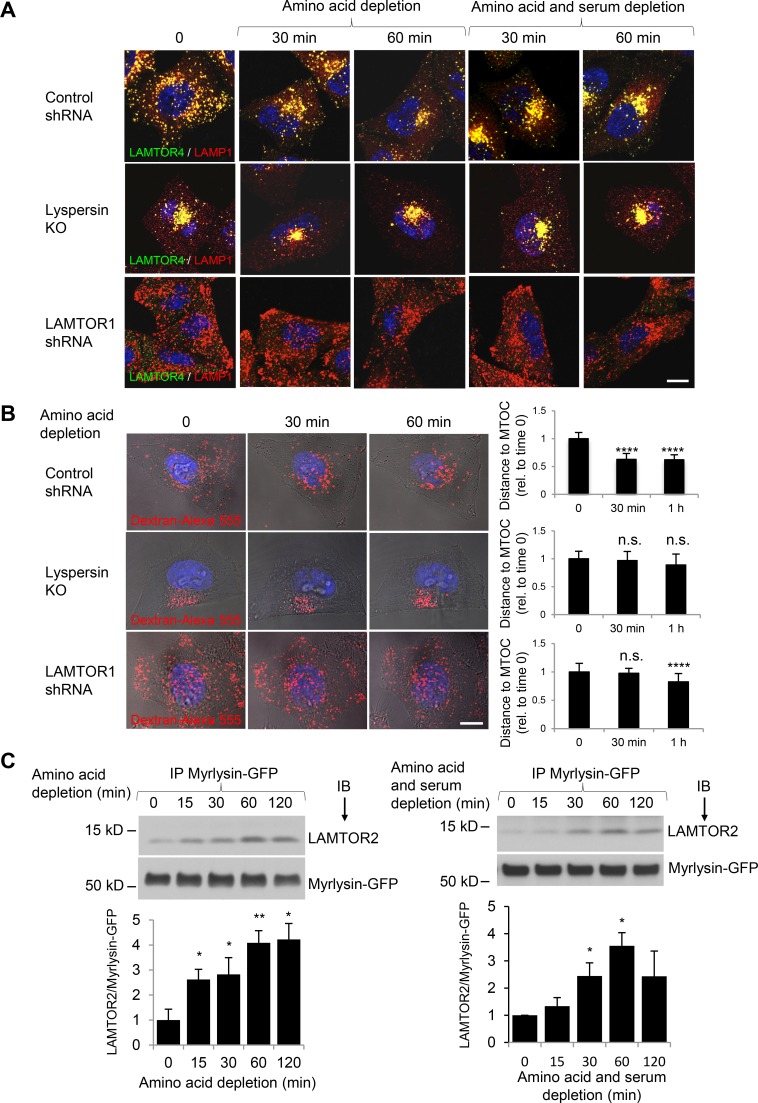
Figure 7.
BORC–Ragulator interactions control lysosome positioning during nutrient starvation. (A) WT HeLa cells transfected with control shRNA or LAMTOR1 shRNA and lyspersin-KO cells were incubated in medium without amino acids, or without amino acids and serum (HBSS), for the indicated times. Cells were immunostained with antibodies to LAMTOR4 and LAMP1. Bar, 10 µm. (B) Cells as in A were allowed to internalize dextran–Alexa Fluor 555 for 6 h at 37°C and chased overnight. Cells were placed in amino acid–depleted medium and imaged live. Each row shows images of the same cell at different times of amino acid starvation. Bar, 10 µm. The distance between lysosomes and the MTOC in control-KD (15 cells from four independent experiments), LAMTOR1-KD (18 cells from four independent experiments), and lyspersin-KO cells (15 cells from three independent experiments) was quantified using Imaris, and the mean ± SD at each time point was normalized to the mean distance at time 0. ****, P < 0.0001; n.s., not significant (ANOVA). (C) Myrlysin-KO HeLa cells stably expressing myrlysin-GFP were incubated in medium lacking amino acids or amino acids and serum. Cells were then subjected to immunoprecipitation (IP) with GFP-Trap beads, followed by immunoblotting (IB) with antibodies to LAMTOR2 and GFP. The positions of molecular mass markers (in kilodaltons) are indicated on the left. Bar graphs show the ratios of LAMTOR2 to myrlysin-GFP quantified by densitometry. Values are the mean ± SD from three independent experiments. *, P < 0.05; **, P < 0.01 (ANOVA).

