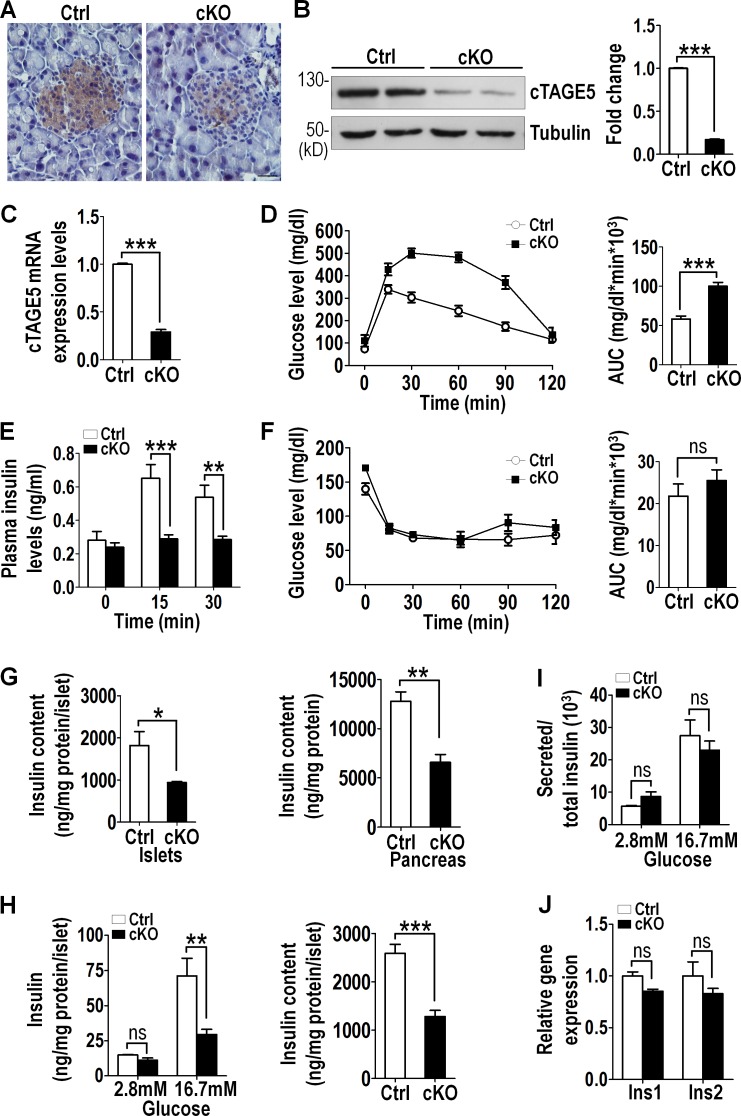
Figure 1.
cTAGE5 cKO leads to reduced insulin biogenesis and glucose intolerance. All mice used here were 8-wk-old male mice. (A) cTAGE5 expression was analyzed by immunohistochemistry on pancreas sections. Ctrl, control. Bar, 20 µm. (B) Western blotting analysis of cTAGE5 expression in isolated islets. Quantitation of cTAGE5 protein levels normalized to tubulin loading control shown at right. (C) Relative cTAGE5 mRNA expression in isolated islets detected by real-time PCR (n = 4). (D) IPGTT was performed. Area under the curve (AUC) shown at right (Ctrl and cKO, n = 10). (E) Plasma insulin levels in control (n = 6) and cKO (n = 10) mice during IPGTT. (F) IPITT was performed. Area under the curve shown at right (Ctrl and cKO, n = 6). (G) Total insulin content in isolated islets and pancreas (Ctrl and cKO, n = 4). (H) Isolated islets were cultured in vitro (Ctrl and cKO, n = 9). Glucose-stimulated insulin secretion and total insulin content were measured. (I) Glucose-stimulated insulin secretion was normalized by total insulin content. (J) Relative Ins1 and Ins2 mRNA expression in isolated islets was analyzed by real-time PCR (Ctrl and cKO, n = 4). All data are means ± SEM (Student’s t test) from three independent experiments. *, P < 0.05; **, P < 0.01; ***, P < 0.001; ns, not significant.

