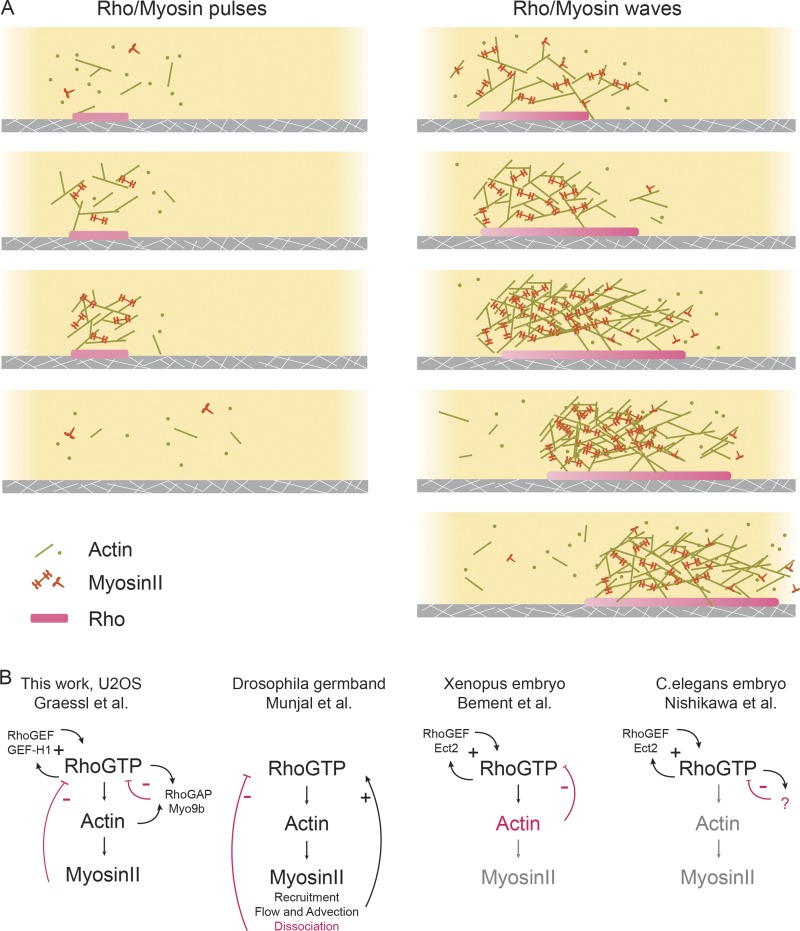
Figure 1.
Excitable Rho signaling networks underlying contractile patterns. (A) Schematic illustration of Rho and actin dynamics in contractile pulses and waves. (B) Various models of the activator–inhibitor network proposed in different experimental systems. Texts and arrows in black or magenta indicate components involved in positive or negative feedbacks, respectively. Text in gray indicates components not essential for the feedback loops.

