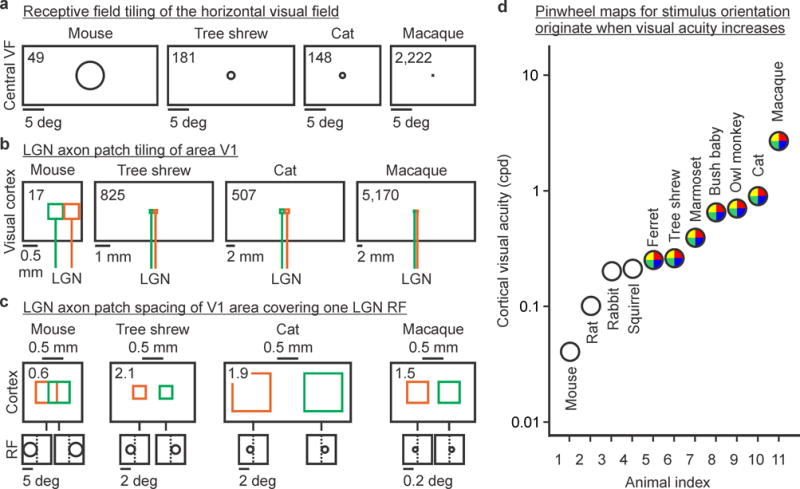
Figure 2.

Thalamocortical networks underlying the organization of visual cortical maps. a, Number of non-overlapping LGN receptive fields needed to tile a horizontal line across the visual field (shown on top left corner of each rectangle, taken from column 7 in Table 2). Only 1/10 of the horizontal visual field is represented for illustration purposes. b, Number of non-overlapping LGN-axon-patches needed to tile a horizontal line through area V1 (shown on top left corner of each rectangle, taken from column 3 in Table 3). Green and orange colors represent two different afferents. c, The largest spacing between two LGN-axon-patches covering one LGN receptive field in visual cortex (shown on top left corner of each rectangle, taken from column 5 in Table 3). For simplicity, axon patches are represented as squares. d, Cortical optimal visual acuity across 11 different species (values obtained from the references cited below). Colored circles indicate pinwheel orientation maps in visual cortex. Mouse: (Niell and Stryker 2008). Rat,Gray squirrel,Bush baby,Owl monkey: (Heimel, Van Hooser et al. 2005). Rabbit: (Zhuang, Stoelzel et al. 2013). Ferret: (Baker, Thompson et al. 1998). Tree shrew: (Johnson, Van Hooser et al. 2010). Marmoset: (Forte, Hashemi-Nezhad et al. 2005). Cat: (Movshon, Thompson et al. 1978). Macaque: (De Valois, Albrecht et al. 1982). VF: visual field. RF: receptive field
