Figure 4.

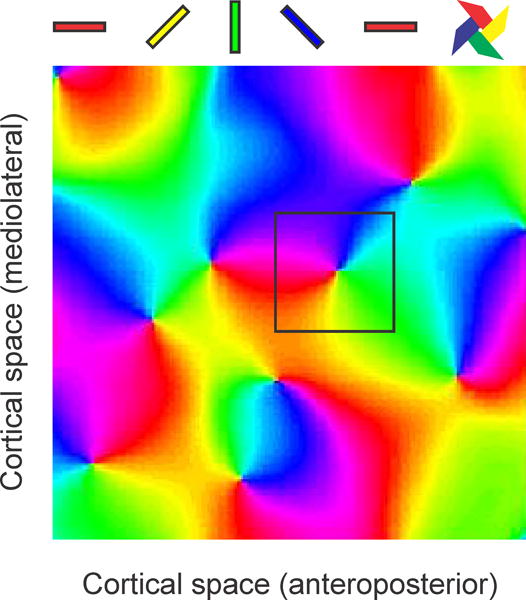
Pinwheel pattern of the cortical map for stimulus orientation. Colors illustrate the different orientations represented on the cortical surface (cat area 17, 2 × 2 mm). A square of 0.5 × 0.5 mm is shown centered on a cortical pinwheel.

Pinwheel pattern of the cortical map for stimulus orientation. Colors illustrate the different orientations represented on the cortical surface (cat area 17, 2 × 2 mm). A square of 0.5 × 0.5 mm is shown centered on a cortical pinwheel.