. Author manuscript; available in PMC: 2017 Dec 5.
Published in final edited form as: Bioorg Med Chem Lett. 2014 Aug 15;24(19):4708–4713. doi: 10.1016/j.bmcl.2014.08.021

Table 2.

Structure and activity of analogues 11
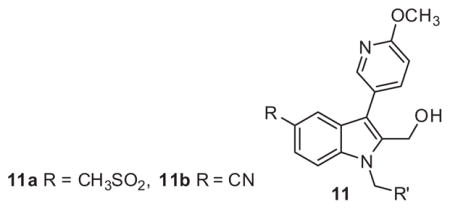
graphic file with name nihms626371u2.jpg
Compd R′ % Max PAC-1a Compd R′ % Max PAC-1a
11a-1 graphic file with name nihms626371t1.jpg 96 11b-1 graphic file with name nihms626371t1.jpg 61/>10b
11a-2 graphic file with name nihms626371t5.jpg 77 11b-2 graphic file with name nihms626371t2.jpg 84
11a-3 graphic file with name nihms626371t6.jpg 78 11b-3 graphic file with name nihms626371t5.jpg 83
11a-4 graphic file with name nihms626371t3.jpg 85 11b-4 graphic file with name nihms626371t6.jpg 85
11a-5 graphic file with name nihms626371t4.jpg 89 11b-5 graphic file with name nihms626371t4.jpg 90
11a-6 graphic file with name nihms626371t7.jpg 87 11b-6 graphic file with name nihms626371t7.jpg 114
a

Values indicate the percentage of Max PAC-1 binding after PAR4-AP stimulation of human platelets.

b

IC50 (μM).16