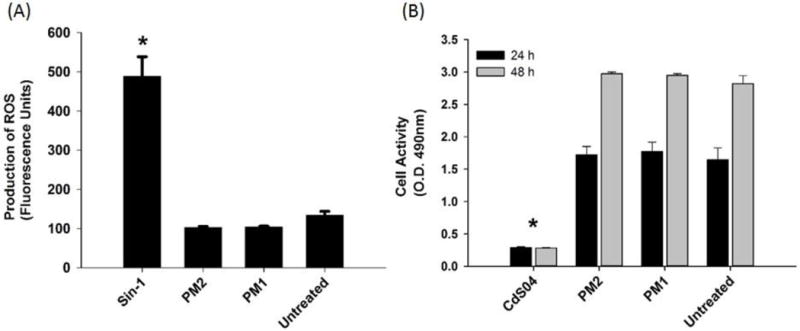
Figure 7.

Intracellular ROS generation and cell activity responses to PM1 and PM2. (A) Production of ROS as measured in A549 cells after exposure to Sin-1 (positive control), PM2, PM1, and no treatment (untreated cells). Intracellular ROS generation was determined by increased DCF fluorescence. * p <0.001 compared to positive control. (B) Cell activity and viability as determined by the quantity of production of formazan, using the MTS Assay. A549 cells were exposed to CdSO4, PM2, PM1, and no treatment (untreated cells), for 24 and 48 h. * p <0.001 compared to positive control.
