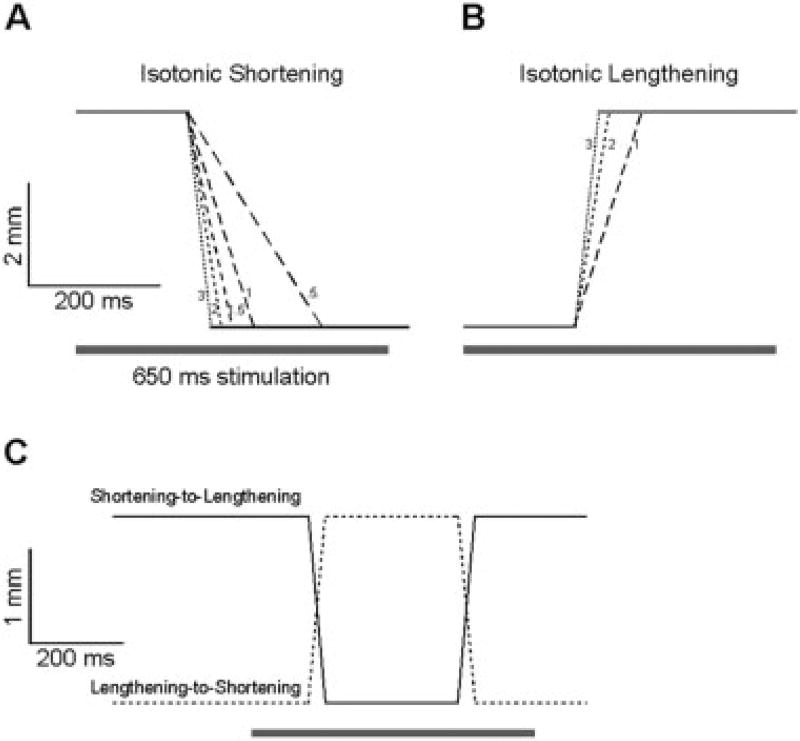
FIGURE 1.
Length changes imposed on the isolated rabbit tibialis anterior muscle during isotonic testing. Muscle length is plotted as a function of time and is approximated by motor position. Muscle velocity is depicted graphically by decreasing dash length as velocity increases and small numbers refer to velocity in units of Lf/s. (A) Shortening ramps ranging from 0.5 to 3 Lf/s are shown. In practice, velocities up to 5 Lf/s were used but are not discernable graphically on this time base. (B) Lengthening ramps ranged from 1 to 3 Lf/s. (C) Combined shortening then lengthening (solid line) and lengthening then shortening (dashed line) protocol described in the text. Bar represents the timing of the 650 ms nerve stimulation period. Note different calibration bars for isotonic experiments (A,B) compared to combined experiments (C).

