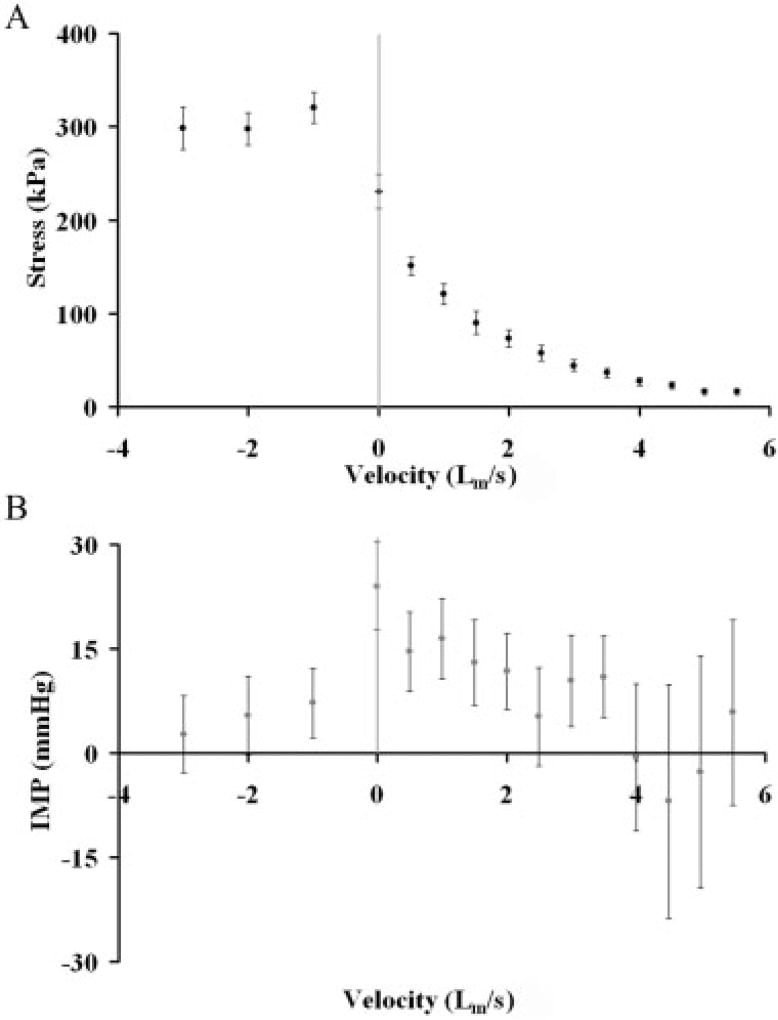
FIGURE 2.
(A) Relationship between muscle stress and velocity for lengthening (negative velocities) or shortening (positive velocities). These data follow the classic force–velocity relationship described in the literature. (B) Relationship between intramuscular pressure (IMP) and velocity across all velocities tested. Each symbol represents mean ± SEM for 10 animals. Note the increased variability of the IMP records compared to stress. Note also that IMP decreases with lengthening in spite of the fact that stress increases.

