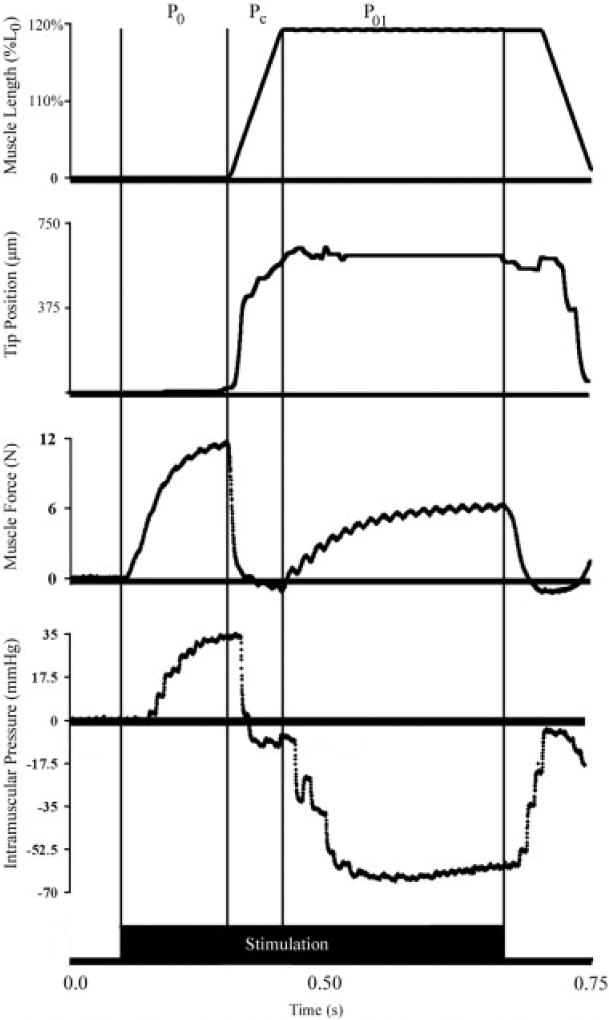
FIGURE 4.
Sample record of muscle length (% L0), transducer tip position (µm), muscle force (N), and intramuscular pressure (mmHg) recordings from a shortening-to-lengthening contraction. The P0, Pc, and P01 regions were determined from the muscle length recording. Linear regression was used to correlate intramuscular pressure and muscle force during these intervals. Intervals are demarked by vertical black lines. Solid bar at bottom of figure represents muscle activation interval.

