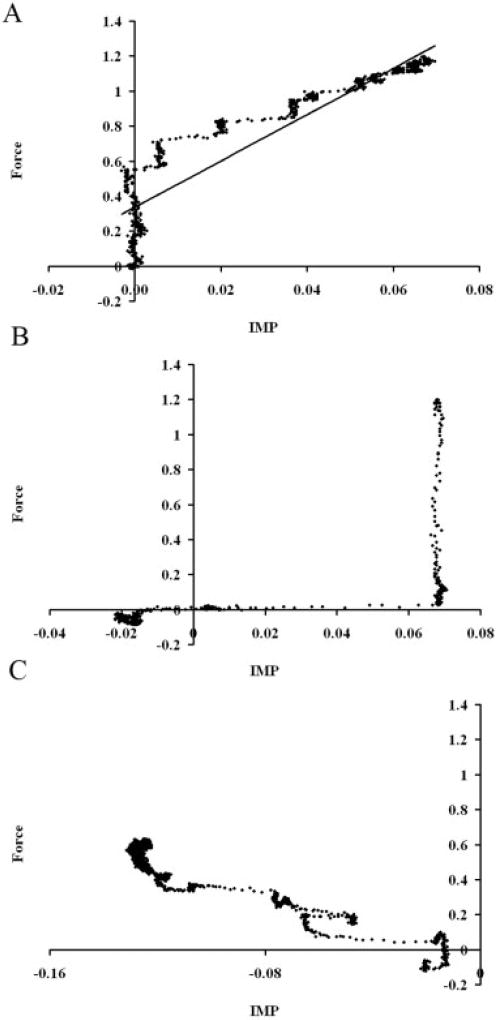
FIGURE 5.
Scatterplots of IMP (fraction I0) versus muscle force (fraction P0) in regions P0 (A), Pc (B), and P01 (C) of Figure 4. A linear relationship between intramuscular pressure and muscle force was found in region P0 (black line; y = 13.2× + 0.34; r2 = 0.86) (A), but this relationship was not the same and was also highly nonlinear in regions Pc (B) or P01 (C).

