
Fig. 3.
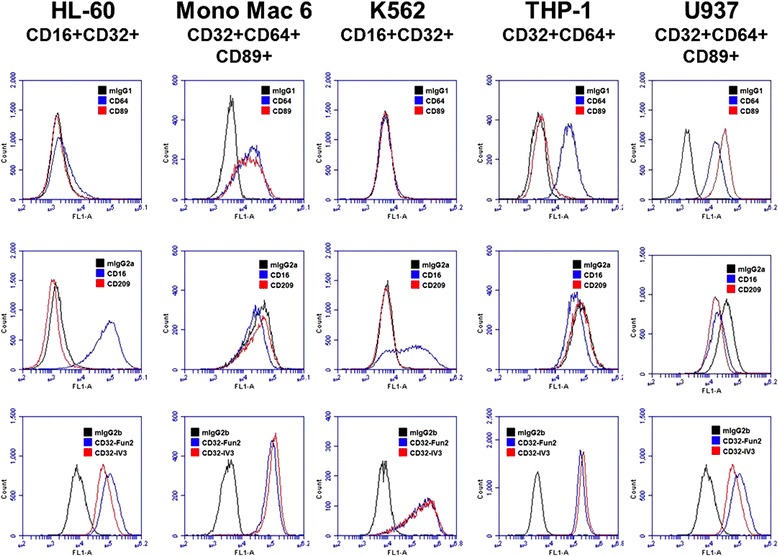
CRP receptor expression on 5 leukemia cell lines. CD16, CD32, CD64, CD89, and CD209 expression on the indicated cell lines was examined by flow cytometry. Top row: Blue trace is CD64, red is CD89. Middle row: Blue is CD16, red is CD209. Bottom row: Blue is CD32-Fun2, Red is CD32-IV3. Black traces are control IgGs. Plots are representative of 3 independent experiments