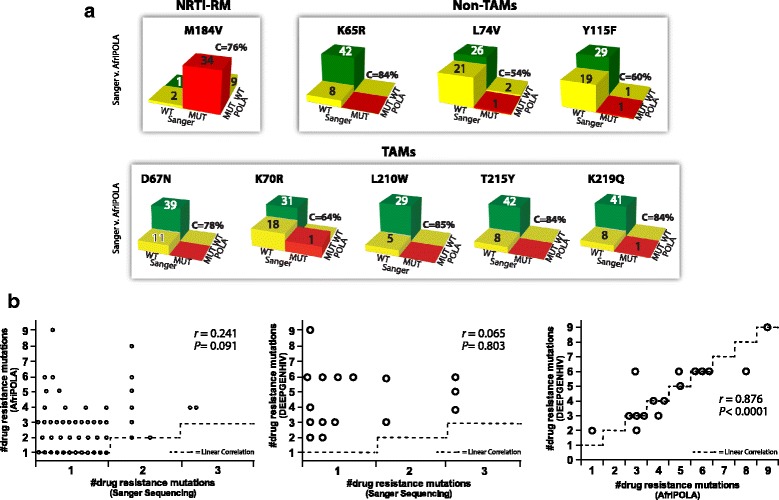
Fig. 4.

Concordance Analysis of Sanger genotyping, AfriPOLA, and DEEPGEN™HIV. a 3D chi square tables display the concordance, Sanger v. AfriPOLA, for each site interrogated. Bar color represents: green bars indicate concordance for WT allele, red bars indicate concordance for mutant allele, yellow bars indicate discordance. b Concordance analysis comparing number of drug resistance mutations reported by each method. Pearson correlation coefficient (r) and statistical significance (p) reported on each graph. Dashed line indicates exact linear correlation
