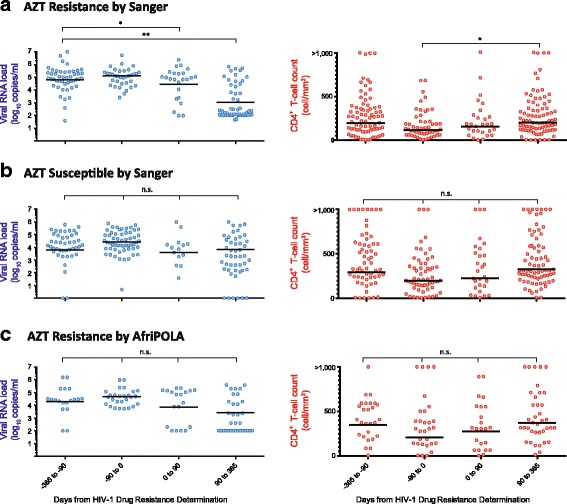
Fig. 5.

Patient HIV-1 RNA Load and CD4+ T Cell Count Receiving First Line Treatment Pre/Post Sanger Resistance Testing. a Patients (n = 157) at the time of Sanger DR testing with resistance to AZT. b AZT susceptible patients (n = 99) at the the time of Sanger DR testing. c Patients (n = 39) resistant to AZT by AfriPOLA. Means and statistically significant differences (ANOVA) are indicated
