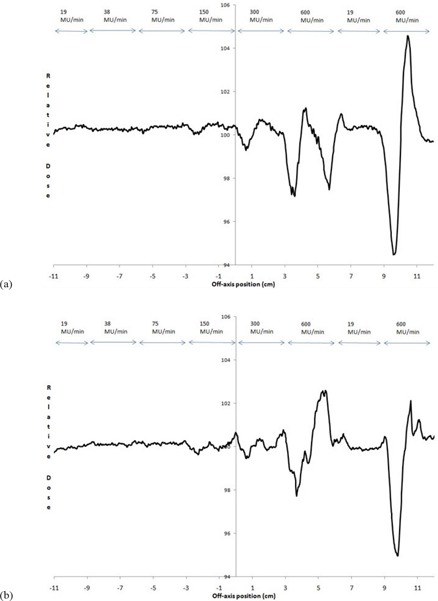
Figure 9. Normalized fluence when DRs were increased as the MLC bank moved from left to right in the a) 6 MV and b) 10 MV. Nominal dose rates for each strip are indicated. The test strip MLC speed was , which was normalized using a similar irradiation having the same DRs and MLC speed of 0.25 cm/sec.

